
Week 9CHAPTER 09
Pitch Deck Mastery
The capstone, where every prior analysis becomes one slide in a single argument to an investor. How investors actually read a deck (the read-alone and live tests, and the six questions every slide must serve); why the founding team carries the earliest decision and how to build the team slide; the standard slide sequence and the practitioner rules that shape it; the market-size slide and why a bottoms-up build earns trust; the team and traction slides; the financial slides as the analytical centerpiece (unit economics, driver-based projections, and burn and runway); the ask slide as a capital-structure negotiation sized by the milestone framework; and the seven ways founders destroy their own pitches, with four interactive calculators that carry the course's analysis onto the slide.
~145 min8 sections48 questions4 tools
Learning objectives (9)
Learning Objectives
By the end of this chapter you should be able to:
- 1Explain why the pitch deck is the capstone where the market, unit-economics, valuation, cap-table, and capital-structure analyses converge into a single argument to an investor.
- 2Apply the two tests a strong deck should pass: the read-alone test when forwarded with no narrator, and the live-presentation test.
- 3Identify the six questions an investor is silently asking, and ensure every slide serves at least one of them.
- 4Explain the evidence that the founding team carries the earliest funding decision, and build a team slide that argues founder-market fit.
- 5Order the standard slide sequence by the weight of the investor question each slide answers, applying the Sequoia sequence and Kawasaki's 10/20/30 rule.
- 6Build a credible market-size slide from a bottoms-up TAM/SAM/SOM build rather than a top-down industry figure.
- 7Construct the traction and financial slides (unit economics, driver-based projections, and burn and runway) so every number is dated, bounded, and defensible.
- 8Size the ask with the milestone framework and price its dilution correctly on the post-money valuation, treating the ask slide as a capital-structure negotiation.
- 9Recognize the seven ways founders destroy their own pitches, and apply the FIN143 integration checklist and the two final tests before sending a deck.
Part One: How Investors Read a Deck: Two Tests and Six Questions. Section 1 of 8.
Part One · How Investors Read a Deck: Two Tests and Six Questions
How Investors Read a Deck: Two Tests and Six Questions
Part One
How Investors Read a Deck: Two Tests and Six Questions
The deck is where every prior analysis meets the investor. This part covers the two tests a strong deck should pass (the read-alone test and the live test) and the six questions investors silently screen for as they read.
The Pitch Deck Is Where Every Prior Analysis Meets the Investor
A pitch deck is not a new piece of analysis. It is the layer that compresses analysis you have already done into a form an investor can evaluate in minutes. By the time a founder builds a deck, the real work is finished: the market has been sized, the unit economics have been modeled, the cap table has been drawn, and the financing plan has been chosen. The deck takes the conclusions of that work and sequences them into a single argument. This is why the deck is the natural capstone of an entrepreneurial finance course. It does not replace the venture economics, the valuation, the cap table, or the capital structure decision. It carries each of those conclusions forward and puts them in front of the person who will fund them.
The consequence is direct. A deck cannot be stronger than the analysis behind it. A founder who has not built a defensible market model cannot present one. A founder who has not computed honest unit economics will either omit them or invent them, and investors are practiced at spotting both. The deck is a compression layer, not a disguise. When founders treat it as a disguise, adding polish to cover thin analysis, they produce the exact document experienced investors are trained to distrust.
Two Tests Every Deck Must Pass
A deck faces two separate evaluations, and it must survive both. The first is the read-alone test. Most decks are not presented; they are forwarded. A partner receives the file, opens it without the founder present, and forms a judgment in a few minutes. On that read there is no narrator to explain a confusing slide, no chance to clarify a number, no voice to supply the context a slide leaves out. Each slide needs to carry its own meaning at a glance.
The second is the live test. In a meeting, the same deck becomes a scaffold for a spoken pitch. Here the founder narrates, and the slides should be lean enough to support the story rather than compete with it. A deck overloaded with text fails the live test because the audience reads instead of listening. The design tension between the two tests is real: the read-alone version wants enough on each slide to stand alone, and the live version wants little enough that the founder carries the room. Strong founders resolve this with a clean core deck and a separate appendix, so the forwarded file is self-sufficient while the presented file stays spare.
What The Evidence Shows
DocSend, which hosts and tracks investor deck views at scale, has repeatedly found that the read is fast and often incomplete. Investors spend on the order of a few minutes on a seed-stage deck, and a large share of decks are never read to the end. The practical implication is not that founders should write less, but that they should order ruthlessly. The slides that answer an investor's largest questions belong early, while attention is still high.
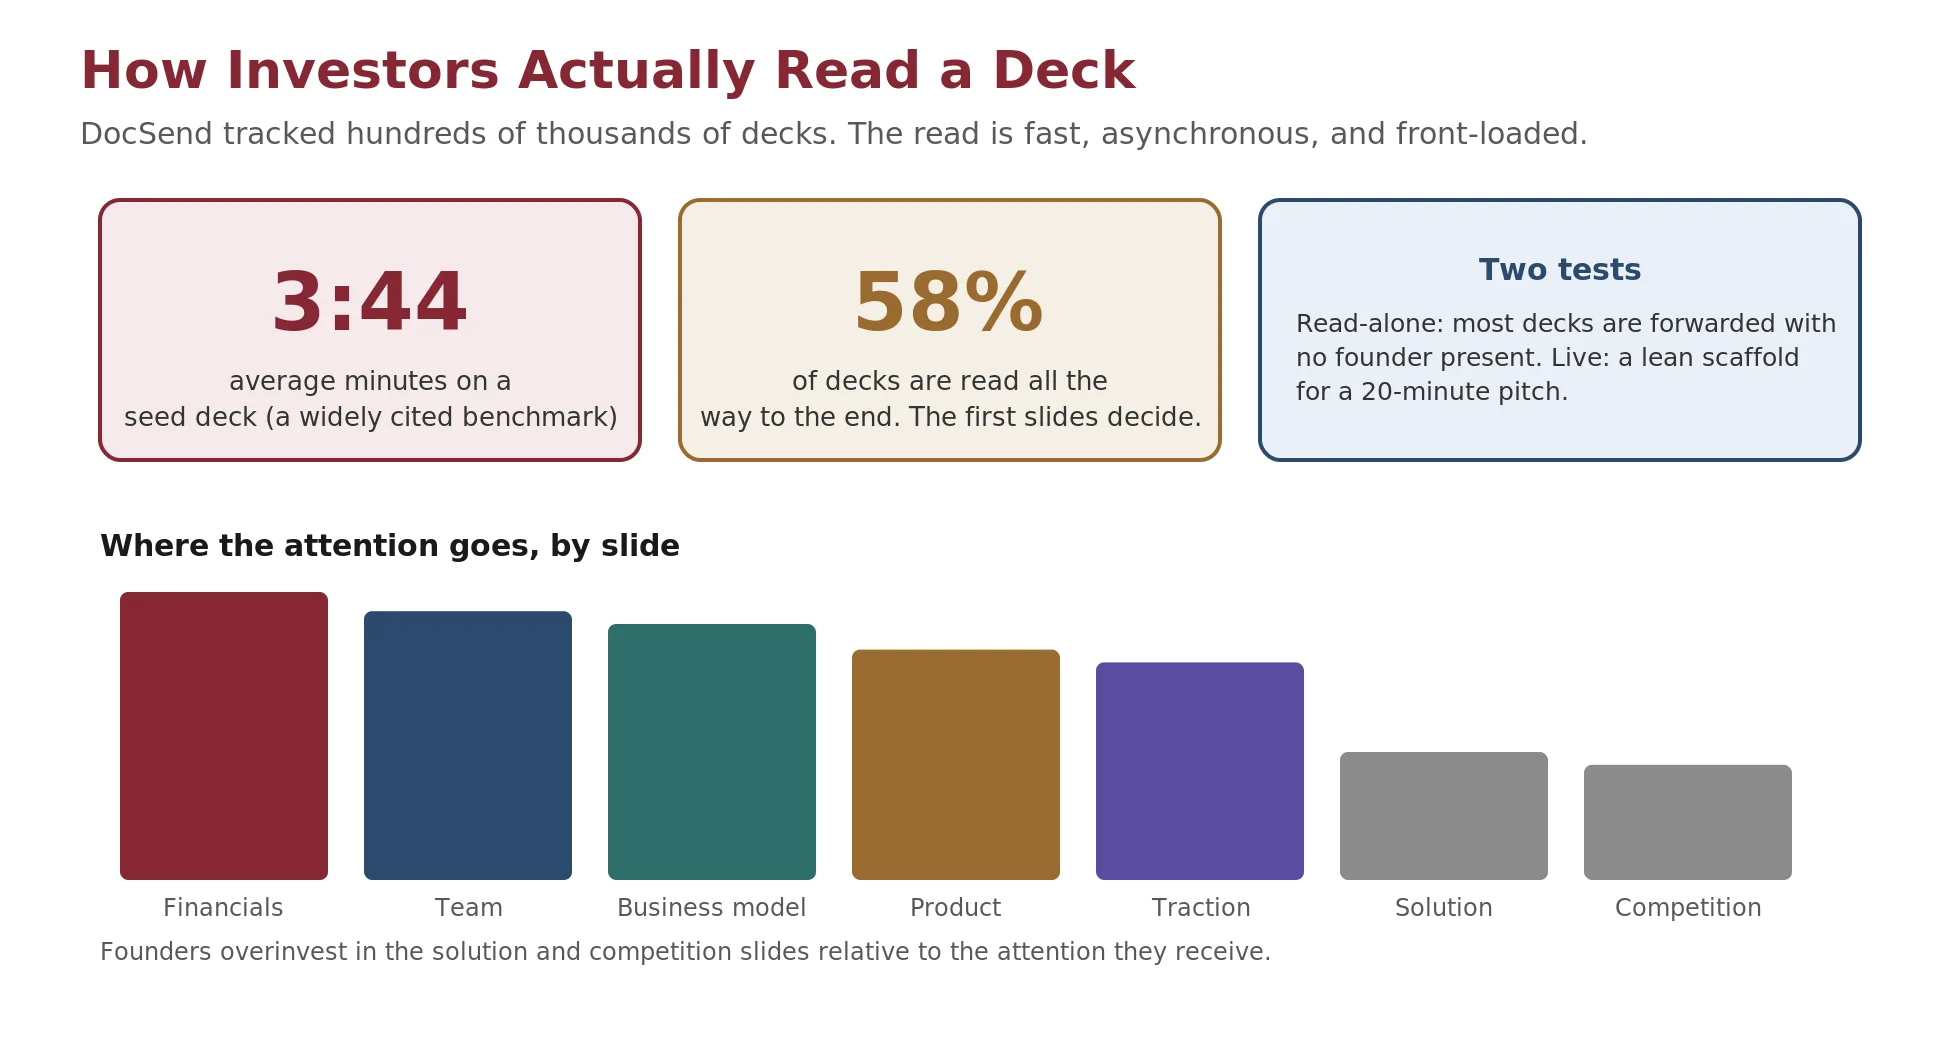
The figure records two findings that anchor the rest of this module. Investors spend an average of roughly three minutes and forty-four seconds on a seed deck, a figure DocSend has reported and that has been widely cited since. Only about 58% of decks are read all the way through. Attention concentrates on the financial, team, and business-model slides and thins on the solution and competition slides, which is the reverse of where many founders spend their effort.
Check Your Understanding
Knowledge Check 1
Pitch Decks & Fundraising Narrative
A founder has already built a market model, a unit-economics model, and a cap table. What is the distinct job of the pitch deck?
Knowledge Check 2
Pitch Decks & Fundraising Narrative
A deck is being forwarded internally at a fund with no founder attached. Which design principle matters most for that read?
Investors Screen for Six Questions, and Every Slide Must Serve One
An investor reading a deck is not absorbing it neutrally. Behind the polite attention is a screen: a short list of questions the deck must answer before the investor will take a meeting, and a shorter list still before the investor will write a check. Six questions capture most of that screen. When a founder understands them, the deck stops being a tour of the company and becomes a set of answers. Each slide earns its place by advancing at least one of the six. A slide that advances none is not neutral; it is a cost, because it spends the investor's scarce attention without moving the decision.
The Six Questions
- Can this return the fund? A venture investor does not need every company to succeed; the fund's economics depend on a small number of investments becoming very large. The investor is asking whether this company could plausibly be one of them. This question ties directly to the power law studied in the venture economics module: because returns concentrate in a few winners, each investment is judged on whether it alone could return the whole fund.
- Can this team execute? Capital is abundant and ideas are cheap; the constraint is a team that can turn a plan into a company. The investor is testing whether these specific founders can build what the deck describes.
- Is the timing right? Most good ideas were tried before and failed because the market was not ready. The investor wants to know what has changed, in technology, regulation, or behavior, that makes now the moment this can work.
- Are the economics real? A growing top line is not the same as a viable business. The investor is checking whether each customer generates more value than it costs to acquire and serve, and whether that improves with scale.
- Can it survive the downside? Not every plan works as drawn. The investor is asking whether the company has enough runway and enough optionality to survive a slower ramp, a missed milestone, or a harder fundraising market.
- Is the market large enough? A company can execute flawlessly and still be a poor venture investment if the market caps out too low. The investor wants a market whose size can support a fund-returning outcome.
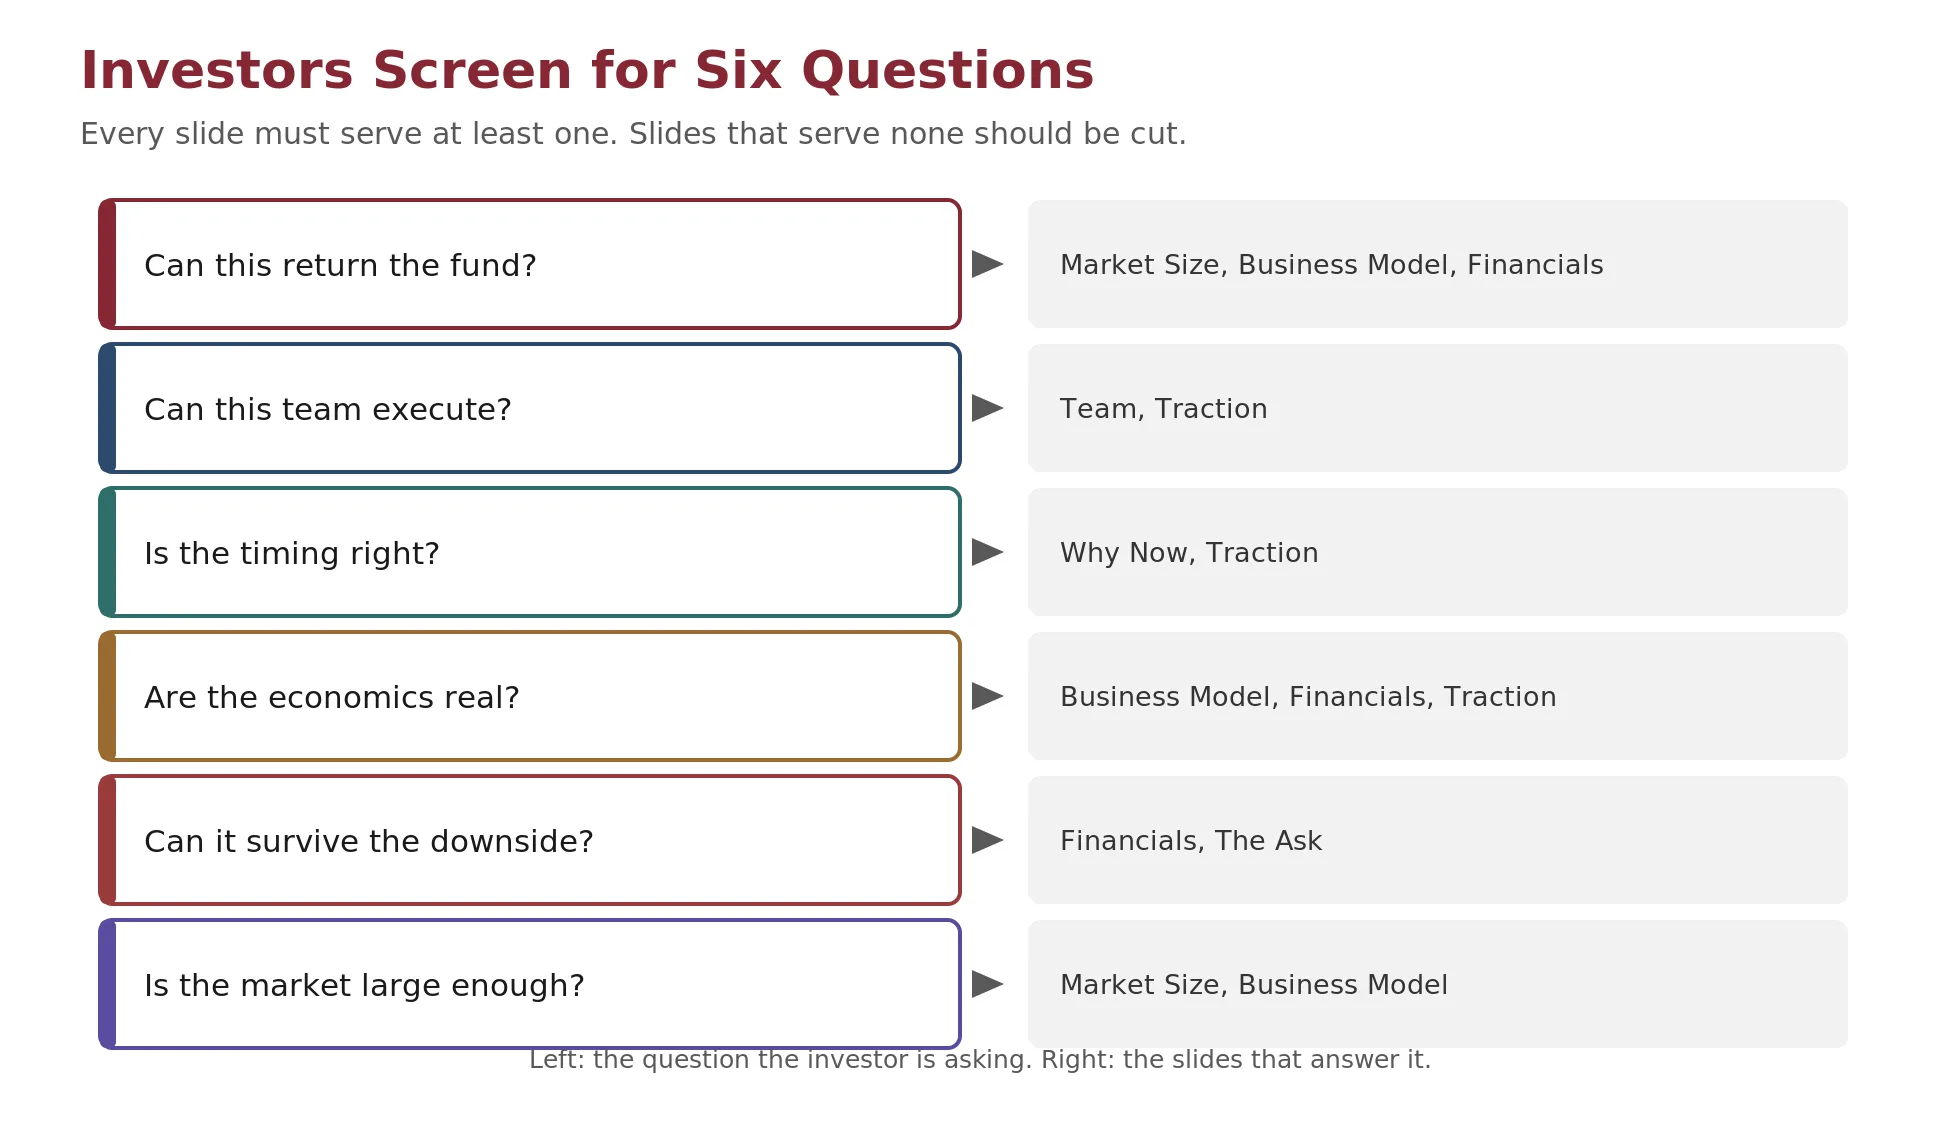
The mapping below shows which slides carry the weight of each question. It is also a cutting tool: build the deck, then ask of every slide which of the six it serves. The slides that serve none are the first candidates to move to the appendix or delete.
| Investor question | Slides that answer it |
|---|---|
| Can this return the fund? | Market Size, Business Model, Financials |
| Can this team execute? | Team, Traction |
| Is the timing right? | Why Now, Traction |
| Are the economics real? | Business Model, Financials, Traction |
| Can it survive the downside? | Financials, The Ask |
| Is the market large enough? | Market Size, Business Model |
Part Two
The Founding Team Carries the Early Decision
Of the six questions, one dominates at the earliest stage. When a company has little product and less revenue, the team is the largest piece of evidence an investor has, and the research shows investors treat it that way. This is not a soft preference stated in interviews; it holds up in large surveys and in a randomized experiment, which makes it one of the better-supported findings in entrepreneurial finance.
Survey and Experimental Evidence
Survey Evidence: The Team Above the Business
Gompers, Gornall, Kaplan and Strebulaev (2020) surveyed 885 venture capitalists at 681 firms about how they actually make decisions. In selecting investments, the VCs rated the management team as more important than business characteristics such as the product or the technology. More striking, when asked to explain why past investments succeeded or failed, they attributed the outcome more to the team than to the business itself. The paper is among the most cited recent studies of how investors actually decide, and its central message for founders is simple: at the point of selection, investors are betting on people at least as much as on the plan.
Experimental Evidence: The Team as the Deciding Signal
Survey answers can reflect what investors believe they do rather than what they do. Bernstein, Korteweg and Laws (2017) tested the behavior directly with a randomized field experiment on AngelList. Across several thousand investors, they randomly varied which information a startup summary showed: the founding team, the current traction, or the existing investors. Investors were most responsive to information about the founding team. Among more experienced, more active investors, the founding-team information was essentially the only content that moved their interest; traction and existing-investor details did not. Two very different methods, a survey and an experiment, point at the same conclusion.
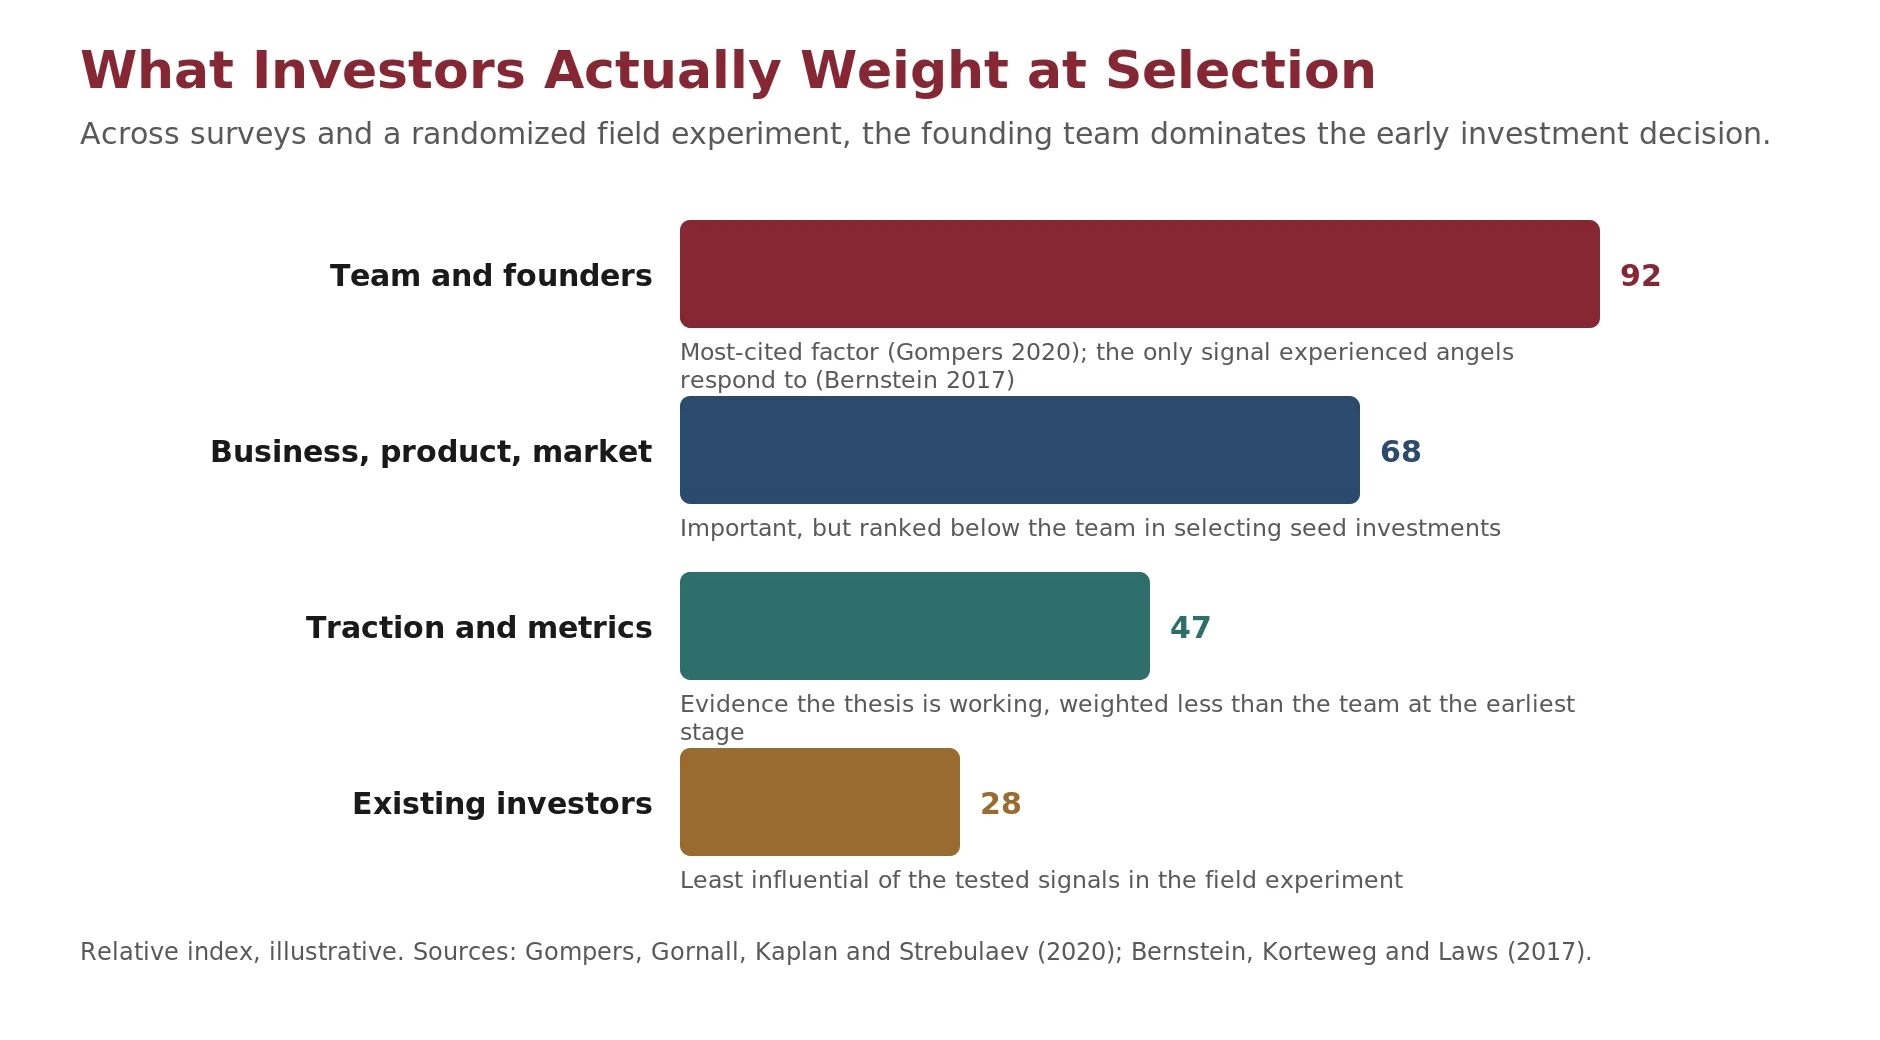
The figure renders that conclusion as relative weight at selection: the team well above the business, product, and market; traction and metrics below that; and social proof from existing investors lowest of the tested signals. The index is illustrative rather than a measured percentage, but the ordering reflects both studies.
Preparedness Beats Passion
If the team carries the decision, what about the team persuades? Not displayed enthusiasm. Chen, Yao and Kotha (2009) studied how venture capitalists respond to business-plan presentations and separated a founder's passion from the founder's preparedness. Using both a controlled experiment and a field study, they found that preparedness, not passion, positively affected the decision to fund. A founder who has done the work, anticipated the hard questions, and can defend the numbers outperforms a founder who is merely excited. This is a direct instruction for how to build and present a deck: the credibility comes from evident preparation, not from energy.
Check Your Understanding
Knowledge Check 3
Pitch Decks & Fundraising Narrative
Across the research on how VCs choose seed investments, which factor consistently ranks highest at the moment of selection?
Part Three
The Standard Slide Sequence
There is a canonical order for a pitch deck, and it is canonical for a reason. The sequence popularized by Sequoia Capital, and the discipline in Guy Kawasaki's 10/20/30 rule, both encode the same insight: the slides should arrive in the order an investor wants to ask the six questions, with one question resolved before the next is raised. A founder does not need to follow the template slavishly, but a founder who reorders it should know which question each move strengthens and which it weakens.
Two Practitioner Rules
Sequoia's Template
Sequoia's template is a roughly ten-slide sequence: company purpose, problem, solution, why now, market size, product, competition, business model, team, and financials, with the ask appended when the deck is used to raise. It is a practitioner convention, not a law, but it has shaped how investors expect to receive information, which is itself a reason to respect it.
Kawasaki's 10/20/30 Rule
Kawasaki's 10/20/30 rule is a memory aid, not a measured finding: at most ten slides, at most twenty minutes of spoken pitch, and a font no smaller than thirty points. The font rule is the sharp one. If a slide's content will not fit at thirty points, the slide has too much text, and the founder is asking the audience to read rather than listen. Treat the three numbers as a discipline that forces compression, not as precise thresholds.
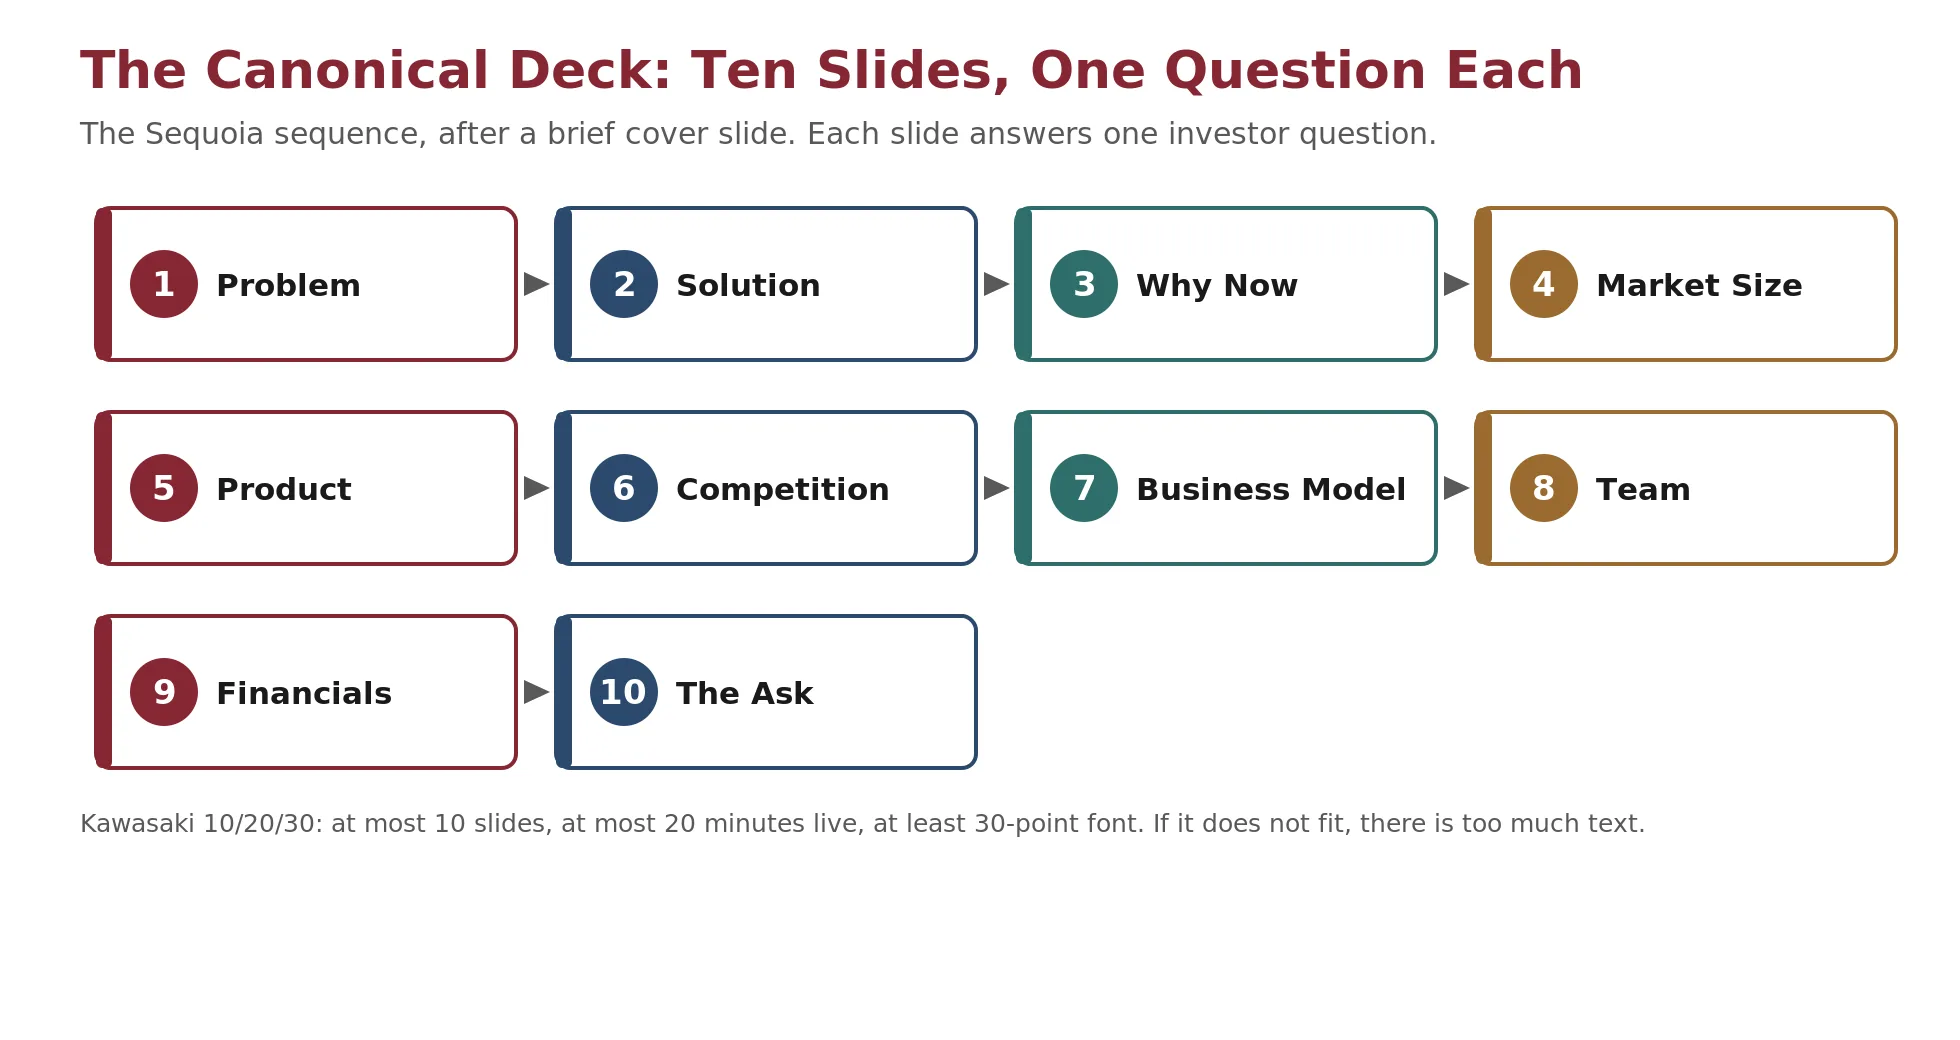
The ten content slides, after a brief cover, each answer one question and build on the one before.
- The problem establishes that a real, painful need exists.
- The solution shows the company's answer to it.
- Why now argues that the timing has changed.
- Market size shows the opportunity is large.
- Product makes the solution concrete.
- Competition places the company honestly in its field.
- The business model shows how value is captured.
- The team shows who will execute.
- Financials show the trajectory and the economics.
- The ask states what is needed and why.
Order by the Weight of the Question
Because attention is front-loaded and many readers stop early, the sequence is not neutral. The slides that answer an investor's largest questions should arrive while attention is high. For most companies that means the problem, the solution, and the market appear early and command the strongest framing, while supporting detail moves later or into an appendix. A founder whose single most compelling asset is traction may lead with it; a founder whose strongest asset is a rare team may bring the team forward. The template is the default, and the ordering principle, matching slide position to question weight, is what tells a founder when to depart from it.
Two Slides the Sequence Names but Founders Underbuild
Two slides in the standard sequence get less attention in this module's later parts because they carry no financial computation, yet each is a common point of failure, and each is the deck-form of an analysis from earlier in the course.
The problem slide
The problem slide has one job: establish that a large, urgent problem exists and identify who suffers from it. It is Week 2's problem-solution diagnostic compressed onto one slide: what specific problem, who has it, and how badly. A strong problem slide names the customer, states the pain in the customer's terms, and quantifies the cost of the problem where a defensible number exists. The classic failures are describing a solution instead of a problem, describing a problem so mild it produces a nice-to-have, and claiming a problem so broad that no specific buyer feels it. If the reader finishes the slide unable to say who is suffering and why they would pay to stop, the slide has not done its job.
The competition slide
The competition slide is where founders most often damage their own credibility, usually by claiming there is none. Week 2's diagnostic already established the discipline: almost every problem already has an existing solution, even if that solution is doing nothing, a spreadsheet, or a hired intermediary. A credible competition slide acknowledges the real alternatives, including the status quo, and then shows a specific, defensible edge over them on a dimension customers care about. "We have no competitors" reads as one of two confessions: the founder has not looked, or there is no market. Naming strong incumbents and stating precisely where the company wins is not a weakness; it is evidence the founder understands the field they are entering.
Check Your Understanding
Knowledge Check 4
Pitch Decks & Fundraising Narrative
An investor spends the DocSend-average of under four minutes on a deck and stops before the end. What does this imply for slide order?
Part Four
The Market-Size Slide Lives or Dies on a Bottoms-Up Build
The market slide answers two of the six questions at once: is the market large enough, and can this company return the fund. It is also the slide where founders most often reach for a number that impresses and least often earn the investor's trust. The reason is method. A market size is only as credible as the way it was built, and there are two ways to build one.
Three Rings: TAM, SAM, and SOM
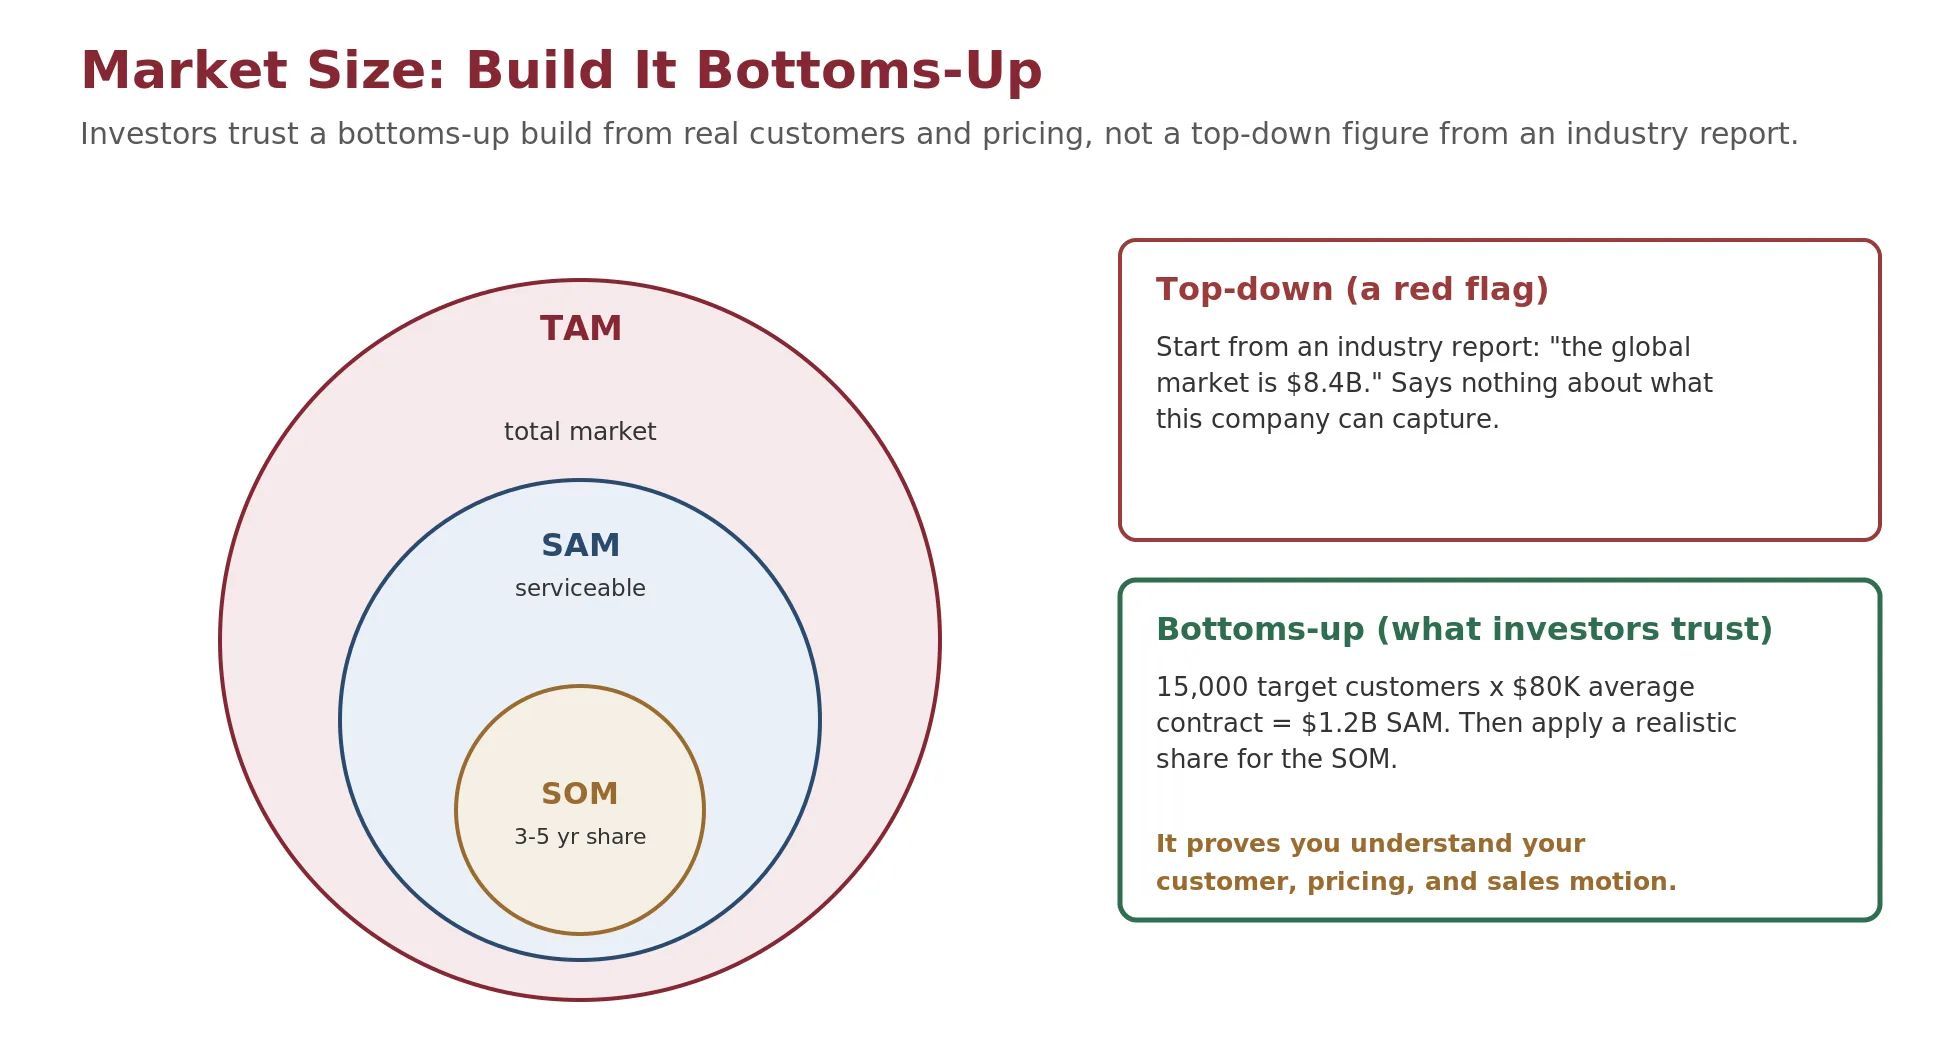
- TAM is the total addressable market, the revenue available if the company captured every possible customer.
- SAM is the serviceable addressable market, the portion the company can actually reach with its product, channel, and geography.
- SOM is the serviceable obtainable market, the realistic share the company can win in a defined near-term window, usually three to five years.
The three narrow from an aspiration to a plan, and investors read the narrowing as a test of whether the founder understands the difference between a market that exists and a market this company can serve.
Top-Down Is a Red Flag; Bottoms-Up Earns Trust
A top-down market size starts from a published industry figure: the global market is $8.4 billion, and the company will capture a few percent of it. Investors tend to distrust this because a percentage of a giant number says little about which customers the company can actually reach or what they will pay. A bottoms-up market size starts from the customer: how many reachable customers exist, and what each will pay. Multiplied out, it produces a figure the founder can defend line by line, because every input is a real quantity the founder has estimated.
Worked Example: Building The Market From The Customer
Consider a company selling software to mid-market retailers. Rather than citing a global retail-technology report, it builds the market from its own customer and price.
| Step | Input | Result |
|---|---|---|
| Reachable customers | 15,000 mid-market retailers the product can serve | 15,000 |
| Average annual contract | Price the company expects each to pay per year | $80,000 |
| SAM = customers x price | 15,000 x $80,000 | $1.2 billion |
| Near-term share | Defensible 3-year share of the SAM | 8% |
| SOM = share x SAM | 8% x $1.2 billion | $96 million |
The SAM of $1.2 billion is not lifted from a report; it is 15,000 customers multiplied by an $80,000 contract, both of which the founder can defend. The SOM of $96 million is 8% of that SAM, a share the founder must justify with the sales motion and the competitive field. An investor can interrogate every number, which is exactly why the build earns trust where a top-down percentage does not.
Enter the total, serviceable, and near-term reachable unit counts, a near-term penetration rate, and the annual contract value (ACV). The calculator returns TAM (total units × ACV), SAM (serviceable units × ACV), and SOM (reachable units × penetration × ACV), the bottoms-up build investors trust, filtering the market to the firms that would actually pay at the real price rather than taking a few percent of a top-down industry figure. This build is finer-grained than the worked example above: it splits the serviceable and reachable tiers and applies penetration to the reachable set. Yet the discipline is identical: every ring is units times price, not a share of a report's headline number.
Check Your Understanding
Knowledge Check 5
Market Sizing (TAM/SAM/SOM)
A B2B startup identifies 15,000 target companies and expects an average annual contract of $80,000. What is the bottoms-up SAM?
Knowledge Check 6
Market Sizing (TAM/SAM/SOM)
A B2B startup projects it can win an 8% share of its $1.2 billion SAM within three years. What is the SOM?
Part Five
The Team and Traction Slides
This part covers the two slides that carry the most weight at the pitch: the team slide, the highest-stakes slide in the deck at the selection stage, and the traction slide, the one place a founder can replace a claim with a fact. We hold two findings in tension (the team wins the meeting while the business wins the exit), then turn to reading traction as a velocity rather than a volume.
The Team Slide Wins the Meeting, but the Business Wins the Exit
Part 2 established that the team carries the early investment decision. That makes the team slide the highest-stakes slide in the deck at the selection stage. Yet there is a second finding that appears to point the other way, and holding both in view is what separates a sophisticated team slide from a resume dump.
The Jockey-Versus-Horse Finding
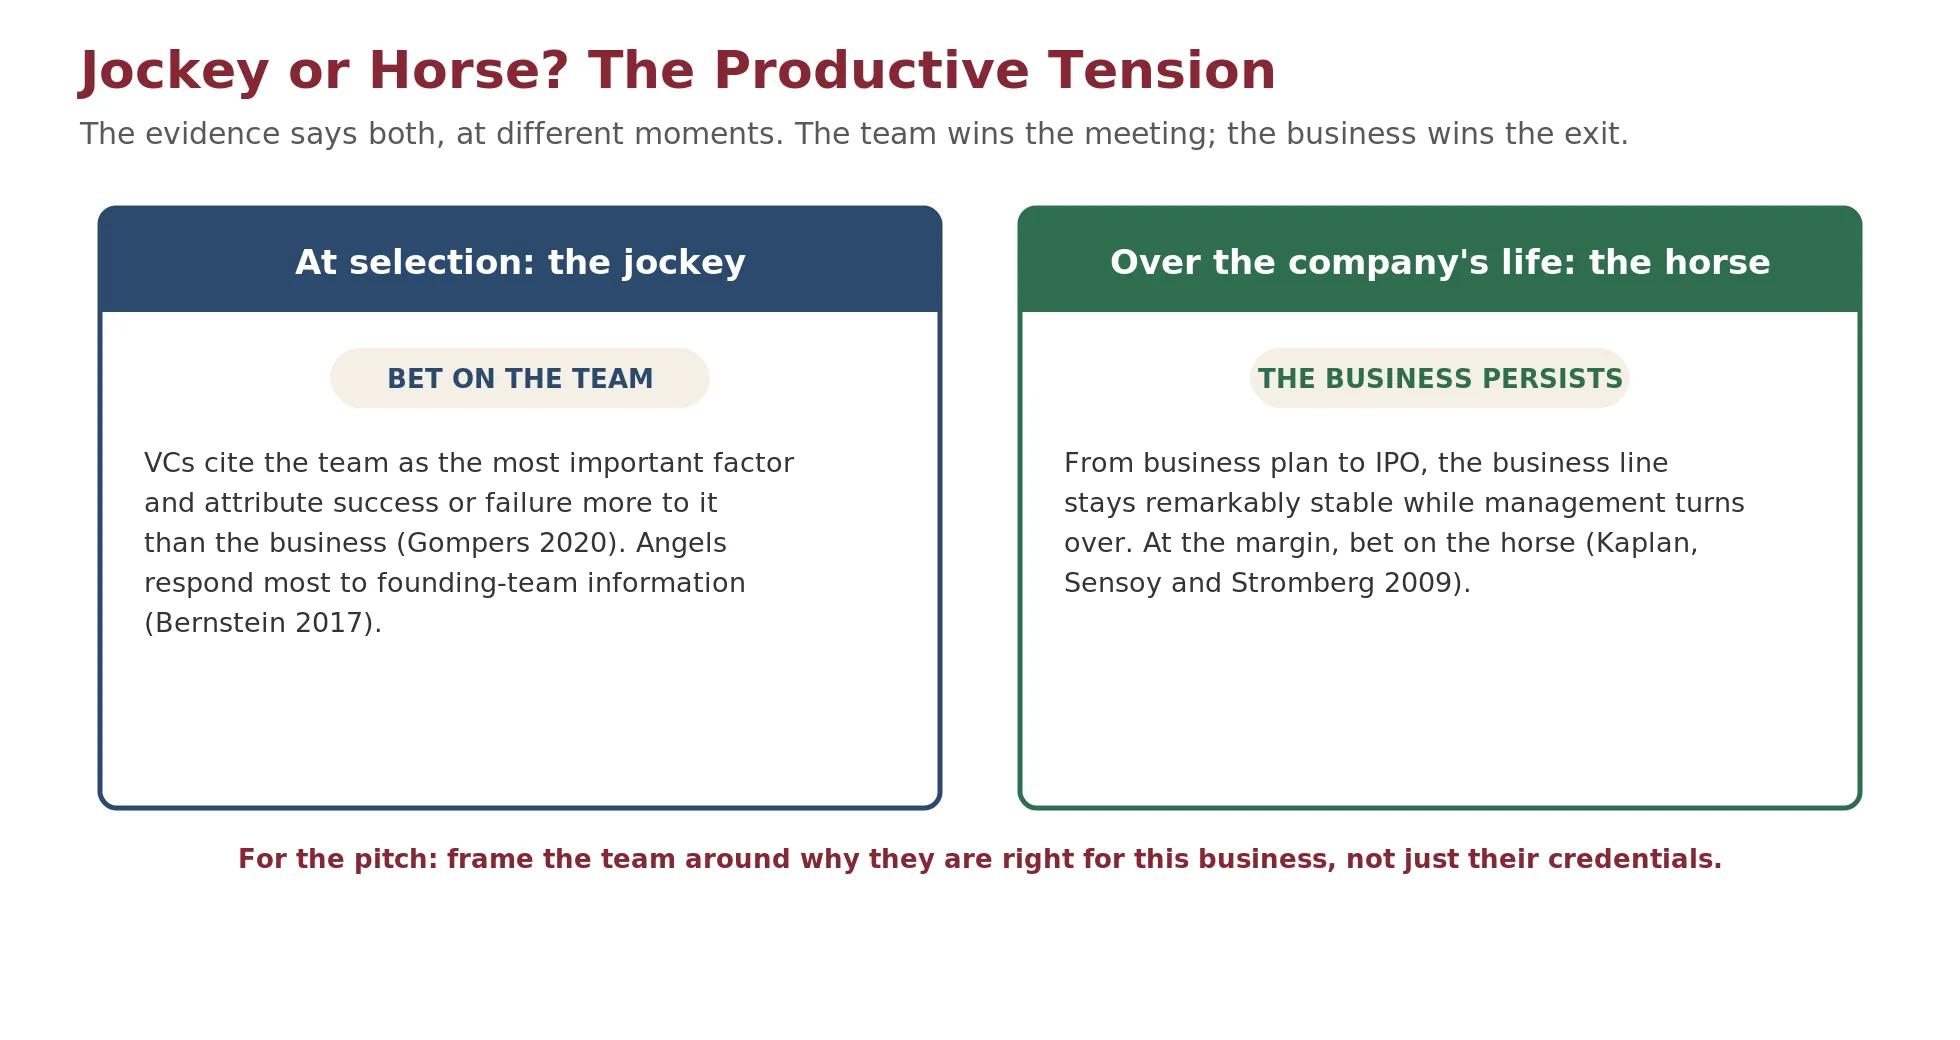
Kaplan, Sensoy and Stromberg (2009) tracked 50 venture-backed companies from their early business plans through to public markets, watching how the business and the management changed. Their result is memorable: the business lines proved remarkably stable, while management turned over substantially. The people in the seats changed far more than the thing the company did. At the margin, they concluded, an investor should weight the business, the horse, over the specific management team, the jockey, because the business is what persists.
This sits in productive tension with the selection-stage evidence. Gompers and Bernstein show that when investors choose, they bet on the jockey; Kaplan, Sensoy and Stromberg show that over the company’s life, the horse is what endures. Both are true because they describe different moments. At the pitch, the team is the strongest signal an investor has, so it wins the meeting. Over the years that follow, the business outlasts any particular set of founders, so it wins the exit.
How to Build the Team Slide
The resolution tells a founder exactly how to frame the team. A team slide built on titles and logos answers the wrong question; it lists credentials without connecting them to this business. The persuasive team slide demonstrates founder-market fit: it shows why these specific founders are unusually well suited to this specific problem, so that the jockey the investor is backing is visibly matched to the horse that will endure. A founder’s prior experience matters only insofar as it explains why they are unusually well placed to see, build, or sell this particular thing. This is the same founder-market-fit logic developed in the founder-frameworks material, now applied to a single slide.
The practical rules follow. Lead with the capabilities that matter for this company, not a chronological history. Make each founder’s background evidence for the mission. Treat advisors and investors as supporting detail, since social proof was the weakest signal in the field experiment. A team slide that reads as why us, why this, why now is worth more than one that reads as an assemblage of impressive logos.
Check Your Understanding
Knowledge Check 7
Founder Archetypes & Identity
A longitudinal study tracked 50 venture-backed firms from their earliest business plans through to their IPOs, comparing how much the business line changed against how much the management team turned over. Which pattern did it document?
Knowledge Check 8
Pitch Decks & Fundraising Narrative
A founder is weighing two findings that pull in different directions: VCs tend to select on the team, yet the business typically outlasts the team. How should the team slide reflect both?
The Traction Slide Proves Velocity, Not Just Volume
Traction is the evidence that the thesis is working in the real world rather than only on the slides. It is the one place a founder can replace a claim with a fact, which is why it carries weight across three of the six questions at once: it shows the team can execute, that the timing is right, and that the economics may be real. The mistake founders make is to present traction as a volume, a single large number, when investors read traction as a velocity.
A Number Without a Timeframe Is Meaningless
Michael Seibel of Y Combinator puts the rule plainly: a traction number means nothing without the timeframe over which it was achieved. Four thousand users in one month is a strong signal; four thousand users in three years is a warning. The raw figure is identical, and the investment implication is opposite. A traction slide that shows a number without the time axis has withheld the only information that makes the number interpretable. Pair the metric with the period, and where possible show the slope, because the rate and its consistency are what an investor is buying.
Choose the Metric That Reflects Real Value
Not all metrics carry equal signal. A north-star metric is the single measure that best captures the value the product delivers, and it should anchor the slide. A vanity metric looks impressive but does not reflect durable engagement or value; raw cumulative signups are the classic example, because by definition they do not fall and so can only flatter. The deeper the metric sits toward realized value, the more an investor trusts it.
| Signal strength | Metric type | What it demonstrates |
|---|---|---|
| Weakest | Vanity totals | Cumulative signups or downloads that only ever rise |
| Moderate | Active usage | Users who return and engage over a defined period |
| Strong | Retention cohorts | Whether customers stay, cohort by cohort, over time |
| Strongest | Revenue and its growth | Paying customers and the rate at which revenue compounds |
Reading Velocity: A Short Illustration
Suppose monthly recurring revenue grew from $20,000 to about $40,000 over five months. That is roughly a 15% compound monthly growth rate, because revenue that compounds at 15% per month doubles in a little under five months. The slide should show the $20,000, the $40,000, and the five-month span together. Stated as monthly recurring revenue doubled in five months, the same numbers become a claim an investor can evaluate, where the figure $40,000 alone, with no time attached, would not.
Check Your Understanding
Knowledge Check 9
Pitch Decks & Fundraising Narrative
A traction slide reads: ‘4,000 users.’ An investor is unimpressed. What is missing that would make the number persuasive?
Part Six
The Financial Slides Are the Analytical Centerpiece
The financial slides are where every analytical module in the course surfaces at once. Three elements carry the weight: unit economics, projections, and the burn-and-runway picture.
Three Elements Carry the Weight
The financial slides are where every analytical module in the course surfaces at once. The unit economics come from the business-model work, the projections from the valuation work, and the burn and runway from the capital-structure work. This is also where investors concentrate their attention, as the reading data showed. A founder who has done the analysis can make these slides the strongest in the deck; a founder who has not will reveal it here faster than anywhere else. Three elements carry the weight: unit economics, projections, and the burn-and-runway picture.
Unit Economics: The Profit on a Single Customer
Unit economics ask whether one customer generates more value than it costs to acquire and serve. Two numbers anchor the slide. The customer acquisition cost, or CAC, is the fully loaded cost to win one customer. The lifetime value, or LTV, is the total gross margin that customer produces over the relationship. The ratio of the two is the headline, and a ratio near or above 3 to 1 is the common health benchmark. A second number, the CAC payback period, states how many months of margin are needed to recover the acquisition cost.
| Metric | Inputs | Result |
|---|---|---|
| CAC | Fully loaded cost to acquire one customer | $1,200 |
| LTV | Total gross margin over the customer relationship | $3,600 |
| LTV-to-CAC | $3,600 divided by $1,200 | 3.0 to 1 |
| Monthly margin per customer | Gross margin each customer yields per month | $100 |
| CAC payback | $1,200 divided by $100 per month | 12 months |
The ratio of 3.0 clears the benchmark, and the twelve-month payback tells the investor how long the company's capital is tied up before a customer turns profitable. Both are defensible because each input is a real, stated quantity, which is the standard the earlier parts set for every number in the deck.
Enter the revenue per customer, gross margin, monthly churn, acquisition spend, and new customers per month, and the calculator returns the CAC, the LTV, the LTV-to-CAC ratio, and the CAC payback period. Use it to test whether a customer clears the roughly 3-to-1 LTV-to-CAC benchmark that marks healthy unit economics.
Projections: Built From Drivers, Not Drawn as a Curve
A five-year projection that rises smoothly to a large number with no supporting detail is the hockey stick investors distrust. The problem is not the shape or the size of the endpoint; it is the absence of drivers. A credible projection is built from the assumptions an investor can interrogate: how many customers, at what price, retained at what rate. When the revenue line is reconstructed from those drivers, the investor can test each one and see that the total is a consequence of the assumptions rather than a number chosen for effect.
A simple internal-consistency check makes the point. If a company plans to serve 500 customers at a $12,000 average annual contract, and retains 90% of that base, the recurring revenue those customers imply is on the order of $5.4 million. That figure should reconcile with the revenue line on the projection. When the revenue on the slide cannot be rebuilt from the customer count, the price, and the retention rate, the projection is asserted rather than modeled, and an investor will find the gap.
Burn and Runway: Can It Survive the Downside
The last financial element answers whether the company can survive if the plan slips. Burn is the net cash the company consumes each month. Runway is how long the cash lasts: cash divided by burn. The arithmetic is simple, and it is exactly what an investor checks against the ask. A company holding $3.6 million and burning $150,000 a month has 24 months of runway, which should be enough to reach the milestone the ask is built around, with margin for a slower ramp.
Formula. Runway = cash divided by burn.
| Input | Value |
|---|---|
| Cash raised | $3,600,000 |
| Net monthly burn | $150,000 |
| Runway = cash divided by burn | 24 months |
| Target milestone | The proof point the raise must reach before the next round |
Enter cash on hand, monthly spend, current revenue, and monthly revenue growth to see the current and worst-case runway along with the Default Alive or Default Dead verdict. Entering $3.6 million of cash and $150,000 of monthly burn (with revenue set to zero) reproduces the 24-month example above.
Check Your Understanding
Knowledge Check 10
Runway, Burn & Financing Need
A startup raises $3.6 million and burns $150,000 per month, with revenue too small to matter yet. What runway does the ask buy?
Knowledge Check 11
Unit Economics & LTV/CAC
A company reports CAC of $1,200 and LTV of $3,600. What is the LTV-to-CAC ratio, and how is it read against the common benchmark?
Knowledge Check 12
Forecasting & Driver-Based Models
A five-year revenue projection rises from $0 to $80 million with a smooth curve and no supporting detail. Why do investors distrust it?
Part Seven
The Ask Slide Is a Capital-Structure Negotiation
The ask is where the capital-structure analysis becomes a negotiating position. It is the shortest slide in the deck and the one that most reveals whether a founder has thought about financing, because a single number rarely answers the questions an investor will ask about it.
Five Questions the Ask Must Answer
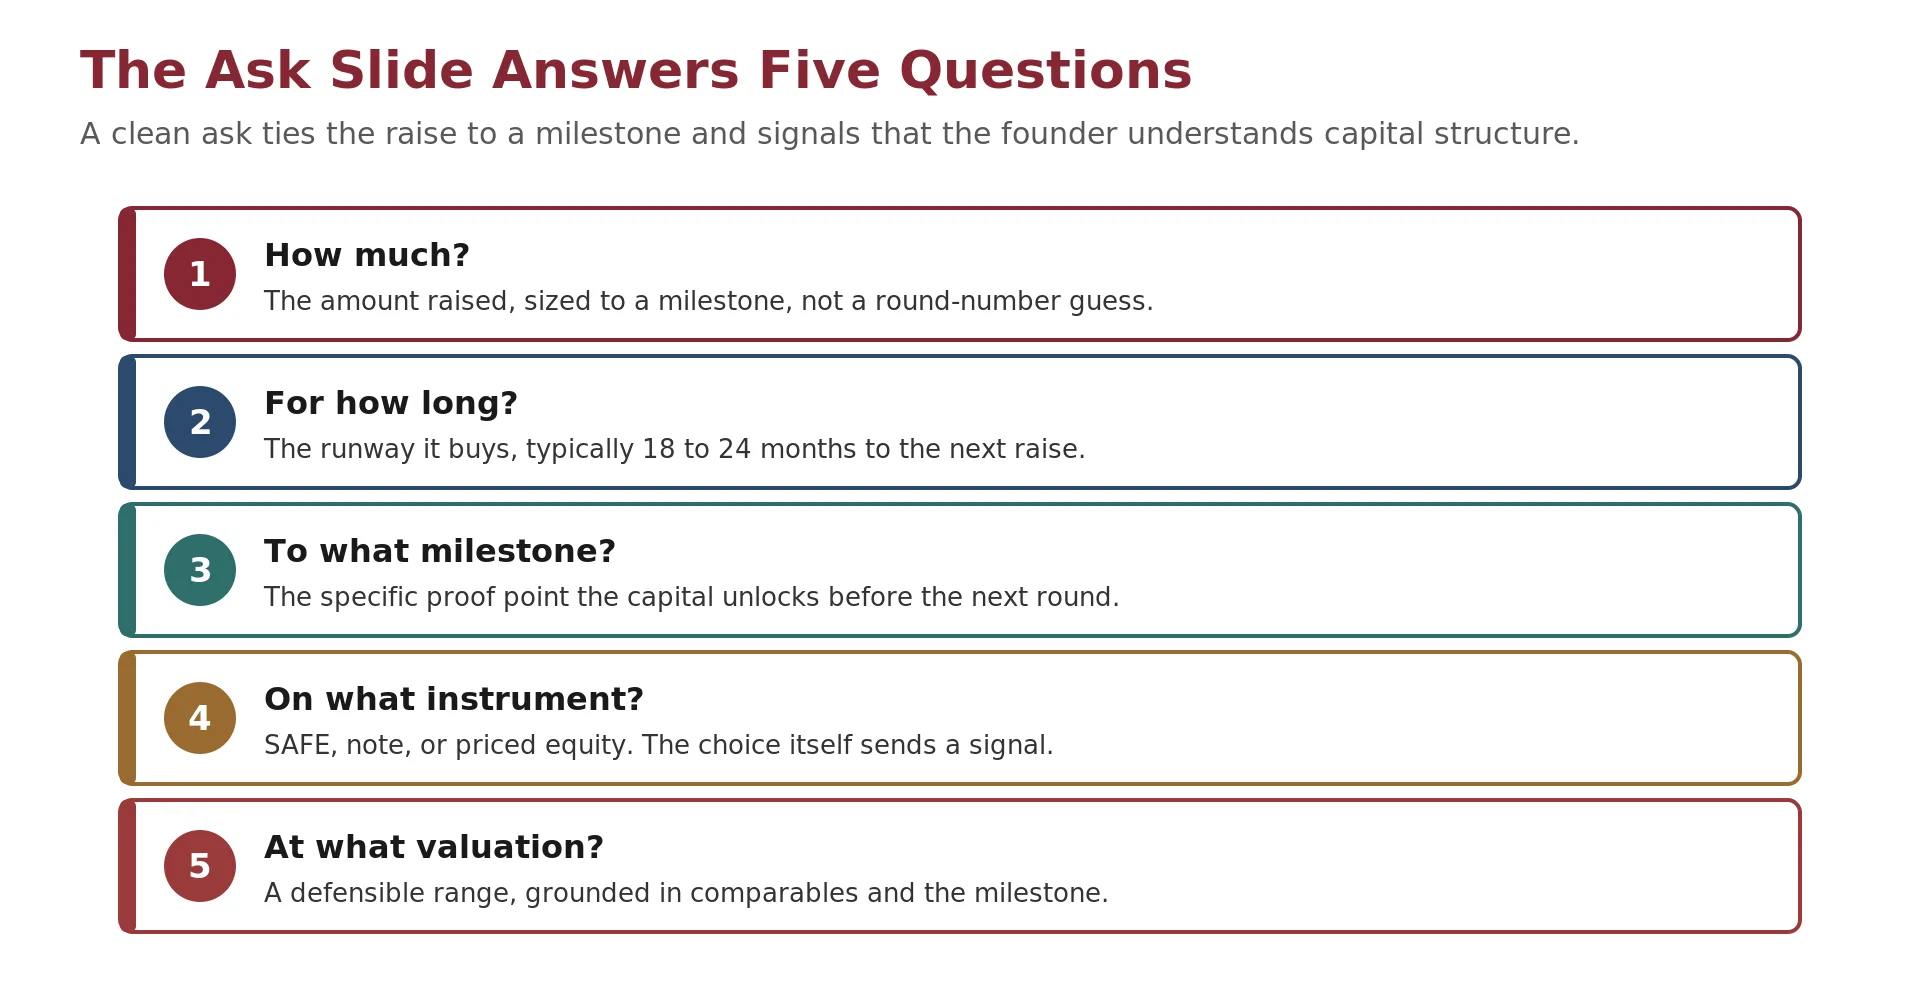
The ask is the slide founders most often reduce to a single line, raising $5 million, and it is the slide where that reduction costs the most. To an investor, the ask is the first concrete evidence of how the founder thinks about capital structure, the subject of an entire module in this course. A strong ask answers five questions, and each answer signals sophistication a bare number rarely conveys.
- How much is being raised, and is the amount sized to a milestone rather than chosen as a round figure.
- For how long, meaning the runway the raise buys, typically eighteen to twenty-four months.
- To what milestone, the specific proof point the capital will unlock before the next round.
- On what instrument, whether a SAFE, a convertible note, or a priced equity round.
- At what valuation, stated as a defensible range grounded in comparables and the milestone the money reaches.
The Milestone Framework Sizes the Number
The amount is not a wish; it is a calculation. A founder sizes the raise by choosing the next milestone that will justify a higher valuation, estimating the burn required to reach it, and adding enough runway to raise again from a position of strength. A raise that buys only twelve months forces the founder back into the market before the milestone lands, which is a weak negotiating position. A raise sized to reach the milestone with runway to spare is what the eighteen-to-twenty-four-month convention encodes.
Worked Example: The Ask Math And Its Dilution
A founder plans to raise capital to reach a milestone that will take about twenty months at a $150,000 monthly burn, which implies a raise near $3 million. Suppose the round is priced at a $9 million pre-money valuation. The cap-table arithmetic then follows directly.
| Step | Calculation | Result |
|---|---|---|
| Runway needed | 20 months at $150,000 per month | $3.0 million |
| Pre-money valuation | Agreed value before the investment | $9.0 million |
| Post-money valuation | Pre-money plus the amount raised | $12.0 million |
| New investor ownership | $3.0M divided by $12.0M post-money | 25% |
| Founder and existing dilution | Share transferred to new investors | 25% |
The founder who presents this ask can state, without hesitation, that the raise buys twenty months to a named milestone and costs 25% of the company, computed on the post-money valuation. The founder who divides by the pre-money figure and reports 33% has made the classic error from the cap-table module, and an investor will notice. The ask slide is where the capital-structure analysis becomes a negotiating position.
The defaults reproduce the worked example above: a $3.0M raise (20 months × $150K burn) at a $9.0M pre-money gives a $12.0M post-money, so new investors take 25% ownership on the post-money, not the 33% figure that comes from mistakenly dividing by the pre-money.
The Instrument Sends Its Own Signal
The choice of instrument communicates before the terms are discussed. A SAFE or a convertible note signals an early, fast round where the founder wants to defer setting a firm valuation and keep legal cost low. A priced equity round signals a later, larger, more negotiated raise. Choosing the instrument well, and being able to explain the choice, tells the investor the founder understands the tradeoffs of dilution, control, and speed that the capital-structures module develops. The instrument is not a formality; it is part of the message.
Check Your Understanding
Knowledge Check 13
Pitch Decks & Fundraising Narrative
A founder's ask slide says only: 'Raising $5M.' Which addition most improves it in the eyes of an investor?
Knowledge Check 14
SAFEs & Convertible Notes
Why does the choice of instrument on the ask slide (SAFE, convertible note, or priced round) carry a signal beyond the dollar amount?
Part Eight
Common Mistakes, Design, and the FIN143 Integration
Most failed decks fail for a small number of reasons, and each of them is typically an analytical failure rather than a design failure. This part catalogs the seven ways founders destroy their own pitches, shows why design is not substance, gives a FIN143 integration checklist that ties each core slide back to the analysis that must stand behind it, sets out two final tests before you send the deck, and closes with the limits of the framework.
Seven Ways Founders Destroy Their Own Pitches
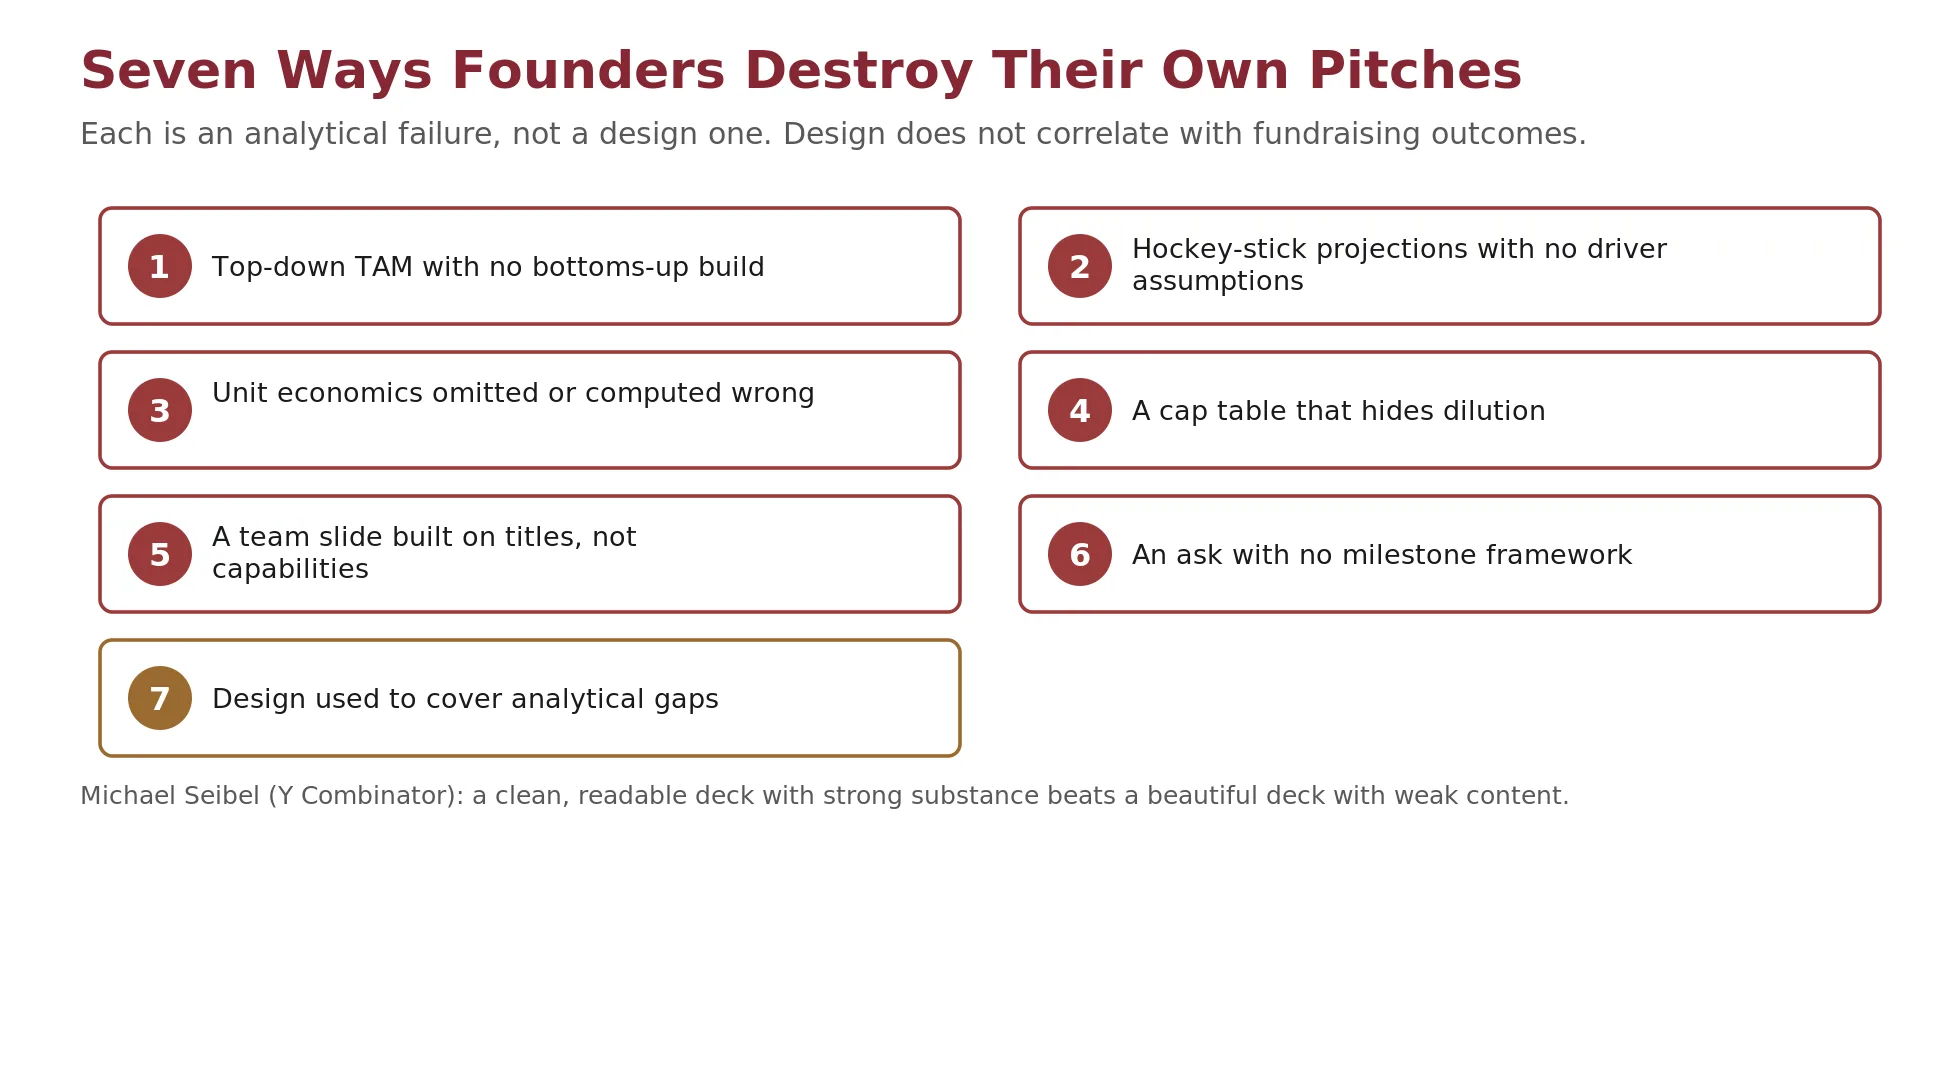
Most failed decks fail for a small number of reasons, and each of them is typically an analytical failure rather than a design failure. A founder who can recognize the seven can audit a deck before an investor does. The through-line is that each mistake is a place where the founder either skipped an analysis or tried to hide that it was skipped.
The seven are:
- A top-down market size with no bottoms-up build
- Hockey-stick projections with no driver assumptions
- Unit economics omitted or computed wrong
- A cap table that hides dilution
- A team slide built on titles rather than capabilities
- An ask with no milestone framework
- Design used to paper over analytical gaps
Each maps to a specific part of this module, and each is fixable by doing the analysis the slide is supposed to present.
Design Is Not Substance
It is tempting to treat a beautiful deck as a competitive advantage. The evidence does not support it. DocSend's research found no correlation between the design quality of a deck and its fundraising success. Michael Seibel makes the operational version of the same point: a clean, readable deck with strong substance tends to beat a beautiful deck with weak content.
Design still matters in one narrow sense, that an illegible or chaotic deck fails the fast read, but clarity is the goal, not beauty. Design that exists to cover thin analysis is the seventh mistake, not a remedy for the other six.
The FIN143 Integration Checklist
Because the deck is the capstone, a founder can check it against the analyses that should stand behind it. Each core slide carries the conclusion of a specific body of work from the course.
- Market Size: Bottoms-up TAM, SAM, and SOM (Market sizing).
- Business Model: How value is captured and priced (Venture economics).
- Traction: Velocity of the north-star metric over time (Unit economics).
- Team: Founder-market fit for this business (Founder frameworks).
- Financials: Unit economics, driver-based projections, runway (Valuation and unit economics).
- The Ask: Milestone-sized raise, instrument, dilution (Capital structures and cap tables).
Two Tests Before You Send It
Two final tests catch most of what remains. The thirty-second test asks whether the core story, the problem, the solution, and why it matters, lands in about thirty seconds, because that is roughly the window before a reader decides whether to keep going. The standalone test asks whether the deck holds together with no founder present to narrate it, which is the read-alone standard from the first part restated as a final check. A deck that passes both is ready; a deck that fails either is not, however polished it looks.
Limits of the Framework
This module teaches a convention shaped largely by early-stage venture norms in the United States. Other stages, geographies, and capital sources evaluate companies differently, and a deck that suits a seed round may be wrong for a growth round, a bank, or a strategic acquirer. Treat the canonical structure as the default for its context, not a universal form.
The finding that investors weight the team most heavily is selection-stage and sample-bound. It comes from surveys and an experiment on particular populations of investors, and it describes the earliest decision, when evidence is thin. As a company matures and produces traction and financials, the weighting shifts toward the business, which is the tension the jockey-versus-horse material develops.
The practitioner rules in this module are heuristics, not measured laws. Kawasaki's 10/20/30 and the Sequoia sequence are conventions that have shaped investor expectations; they are useful because investors expect them, not because a study established an optimal slide count. The benchmarks quoted, a roughly 3-to-1 lifetime-value-to-acquisition-cost ratio, eighteen to twenty-four months of runway, and the reported average deck-review times, are reference points that vary by business and by year.
Above all, a deck cannot be stronger than the company behind it. This module improves how a founder presents a venture; it cannot make a weak venture fundable. The purpose of learning to build a rigorous deck is partly to discover, while building it, where the underlying analysis is not yet strong enough to present.