
Week 7CHAPTER 07
The VC Industry and Fund Economics
The other side of the table: how the venture capital business itself works. Why VC is a small, concentrated asset class with winner-take-most firm dynamics; how it differs from private equity buyout; the three legal entities of every fund (the limited partnership, the management company, and the general partner); the 2-and-20 model of fees and carried interest; the four-tier distribution waterfall and American vs. European timing; the fund lifecycle and the J-curve; performance measurement with DPI, RVPI, TVPI, MOIC, and IRR; why returns follow a power law rather than a bell curve; performance persistence; and how to access the asset class and build a career around it, with four interactive calculators.
~125 min8 sections49 questions5 tools
Learning objectives (9)
Learning Objectives
By the end of this chapter you should be able to:
- 1Explain why venture capital is a small, concentrated asset class with winner-take-most dynamics at the firm level.
- 2Contrast venture capital and private equity buyout on ownership, leverage, return shape, and value creation.
- 3Describe the three legal entities of a VC fund (the limited partnership, the management company, and the general partner) and what each does.
- 4Analyze the 2-and-20 model, computing management fees and carried interest, and explain why fees dominate manager revenue for the average fund.
- 5Work the four-tier distribution waterfall (return of capital, preferred return, GP catch-up, and the carry split) and distinguish American from European waterfalls.
- 6Explain the fund lifecycle and the J-curve, including capital calls, reserves, and the commitment and harvest periods.
- 7Measure fund performance with DPI, RVPI, TVPI, MOIC, and IRR, and explain what each metric captures and hides.
- 8Explain why venture returns follow a power law rather than a normal distribution, and how that reshapes portfolio construction.
- 9Describe performance persistence, the ways to access venture capital as an asset class, and the careers and advisory ecosystem around it.
Part One: Venture Capital Is a Small, Concentrated Asset Class. Section 1 of 8.
Part One · Venture Capital Is a Small, Concentrated Asset Class
Venture Capital Is a Small, Concentrated Asset Class
Part One
Venture Capital Is a Small, Concentrated Asset Class
Venture capital occupies a peculiar position in institutional finance. It is one of the smallest major asset classes by capital under management, yet it funds an outsized share of the companies that reshape entire industries.
Scale and Concentration
Venture capital occupies a peculiar position in institutional finance. It is one of the smallest major asset classes by capital under management, yet it funds an outsized share of the companies that reshape entire industries. Understanding the industry begins with its scale and its concentration.
By industry estimates from sources such as PitchBook and the National Venture Capital Association, as of 2025 U.S. venture capital firms collectively manage roughly $1.2 trillion in assets. That is a large number until it is set against the more than $10 trillion U.S. private funds market (private equity, private credit, and real assets, with U.S. private equity alone managing roughly $4 trillion) and the tens of trillions in U.S. public equity. Venture capital is a small pond, and the firms that dominate it are a handful of recognizable names.
Concentration
The concentration is striking. A small number of the largest firms capture a disproportionate share of new capital raised. As of late 2025 and early 2026, based on firm disclosures and press reports, Andreessen Horowitz manages more than $90 billion, and firms such as Sequoia Capital and General Catalyst manage tens of billions each. These are no longer scrappy partnerships writing $1 million seed checks; they are multi-strategy platforms with growth, crypto, and sector-specific funds.
The venture capital industry exhibits the same winner-take-most dynamics it seeks to fund. A small number of firms attract a disproportionate share of capital, deal flow, and returns. The figures here are a 2025 to 2026 snapshot and move over time.
Check Your Understanding
Knowledge Check 1
VC Fund Economics (Fees, Carry, Waterfalls)
How does the U.S. venture capital industry compare in size to public equity and private equity?
Venture Capital and Private Equity Are Different Businesses
Venture capital and private equity buyout are often grouped together as private capital, and they share the same 2-and-20 fund shell. The businesses themselves are fundamentally different, and the differences are structural, not just a matter of check size.
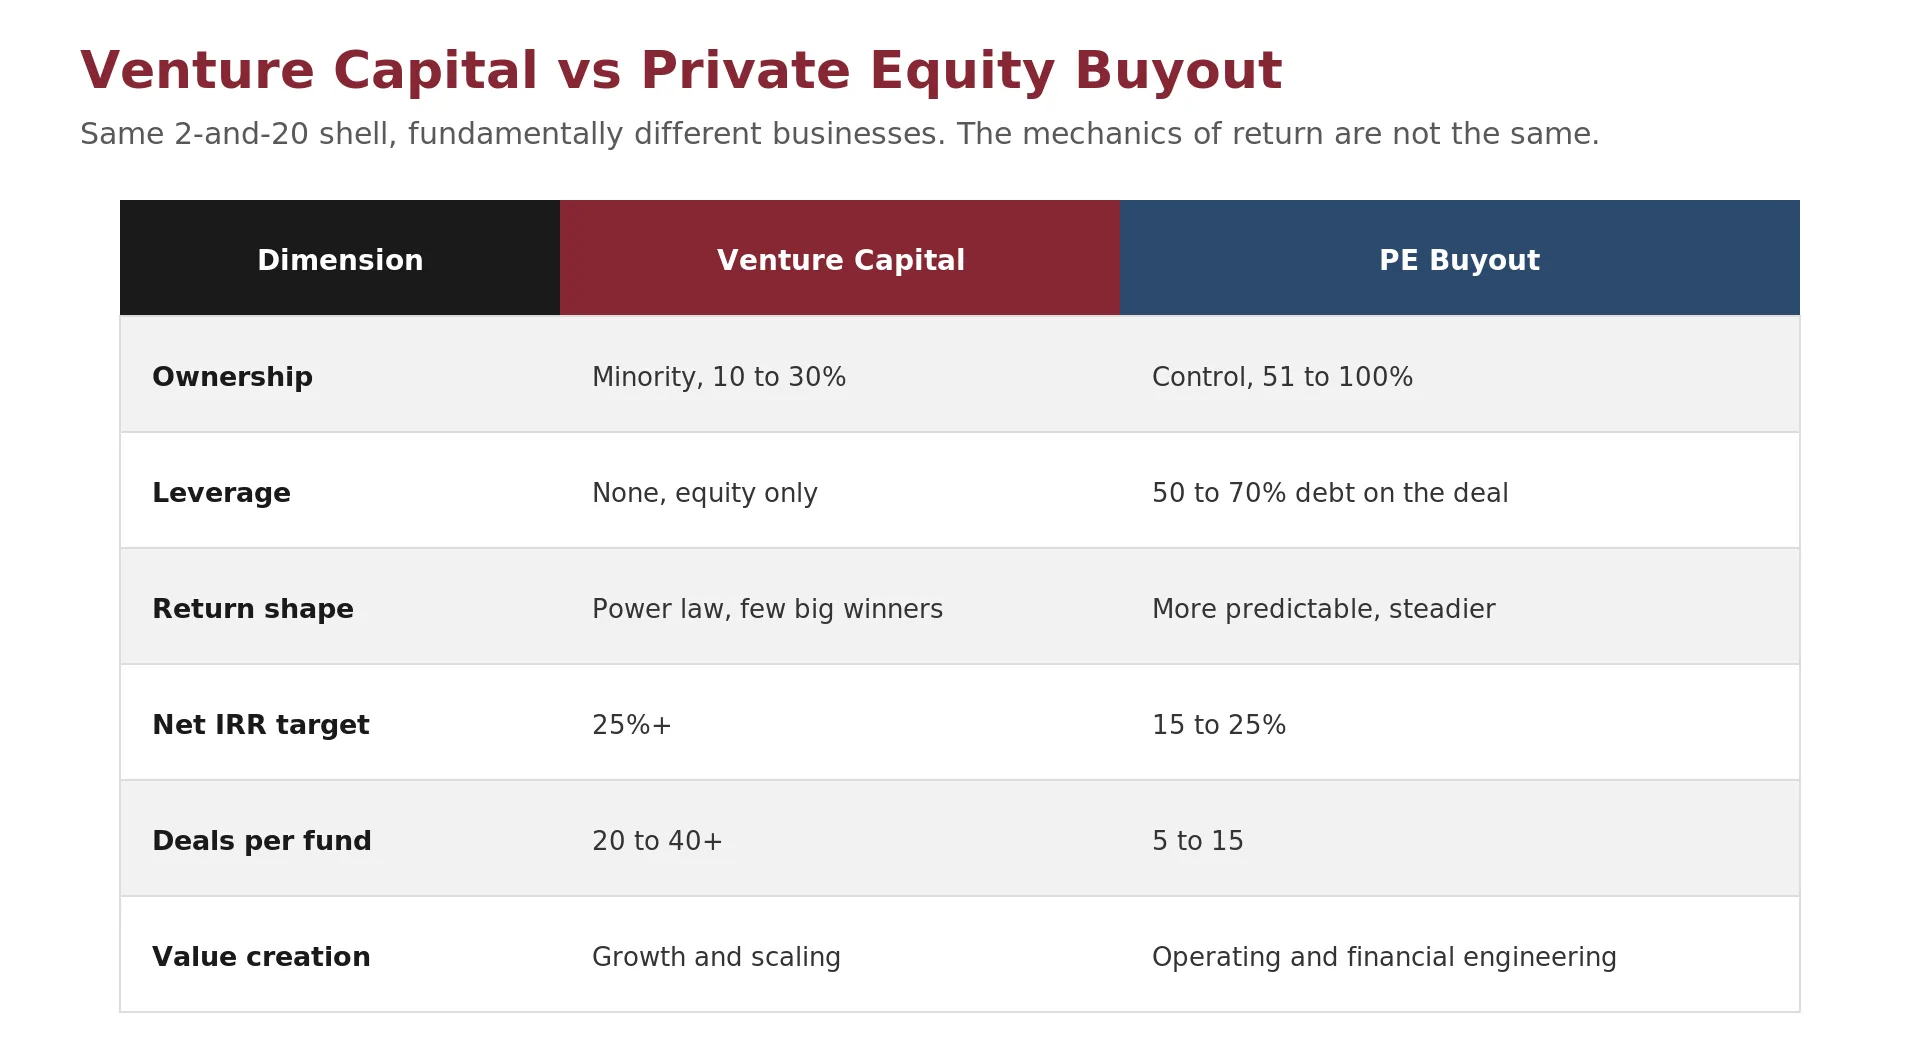
A venture fund buys a minority stake, commonly 10 to 30%, in a young company and uses no leverage. Its return comes from growth, since a handful of investments must become very large. A buyout fund acquires a controlling stake, 51 to 100%, in a mature, cash-generating company, and finances the purchase with 50 to 70% debt. Its return comes from operating improvements, debt paydown, and multiple expansion, and its outcomes are steadier than the power-law pattern of venture.
These are archetypes. Growth equity sits between them, buying significant minority stakes in scaling companies, and many large firms now run several strategies at once. The mechanics of return remain distinct. Venture depends on rare outliers, while buyout engineers a more predictable result across a smaller number of controlled companies.
Check Your Understanding
Knowledge Check 2
Capital Structure & Venture Debt
What most fundamentally distinguishes a venture capital investment from a private equity buyout?
Part Two
Every VC Fund Is Three Legal Entities, Not One
A single VC fund is not one company but three separate legal entities, each with a distinct job. This part sorts out which entity holds the money, which earns the fee, and which earns the carry.
One Fund, Three Legal Entities
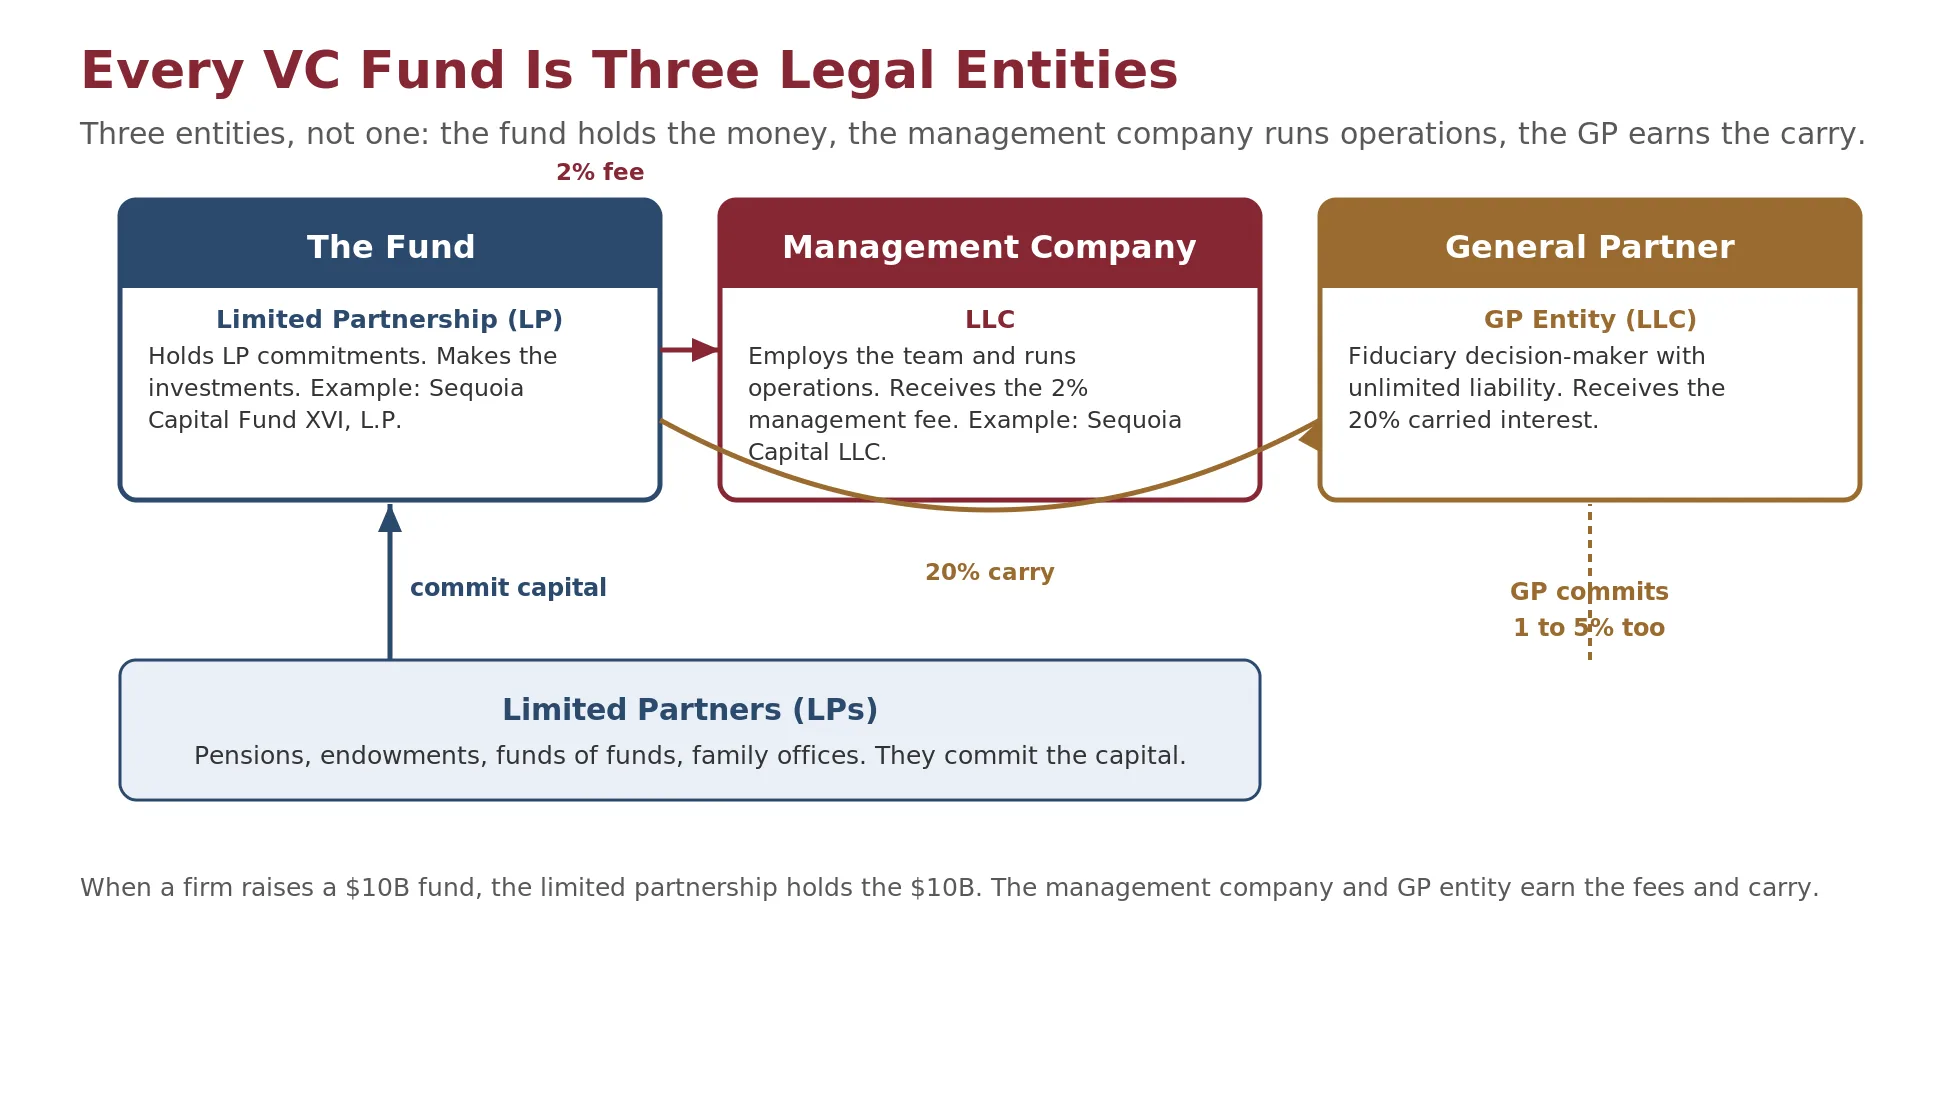
When a firm says it raised a $10 billion fund, three separate legal entities are actually involved, and confusing them is a common error. Understanding which entity does what is essential for anyone advising, auditing, or working at a VC firm.
Which Entity Does What
- The limited partnership is the fund itself. It holds the capital that limited partners commit, and it makes the investments.
- The management company is a separate operating business, usually an LLC, that employs the investment team and receives the annual management fee.
- The general partner entity is a third entity, also usually an LLC, that serves as the fund's general partner. It has fiduciary responsibility for investment decisions and unlimited liability, and it receives the carried interest.
Separating the GP entity from the management company provides legal insulation between the investment function and the operating business. When a firm raises a $10 billion fund, the limited partnership receives the $10 billion in commitments. The management company receives roughly 2% of that each year as a fee, and the GP entity receives 20% of the profits as carried interest. The money and the roles sit in different places.
Check Your Understanding
Knowledge Check 3
VC Fund Economics (Fees, Carry, Waterfalls)
A venture capital fund is typically organized as three separate legal entities: a limited partnership that holds the committed capital, a management company that receives the annual management fee, and a general partner entity that serves as fiduciary decision-maker with unlimited liability. Which entity receives the carried interest?
Part Three
The 2-and-20 Model Drives Fund Economics
The standard economic model for a venture fund is 2 and 20: a 2% annual management fee on committed capital and a 20% carried interest on investment profit. The model has proven durable, though the specific terms vary by firm size, fund vintage, and LP negotiating power.
Management Fees Fund Operations
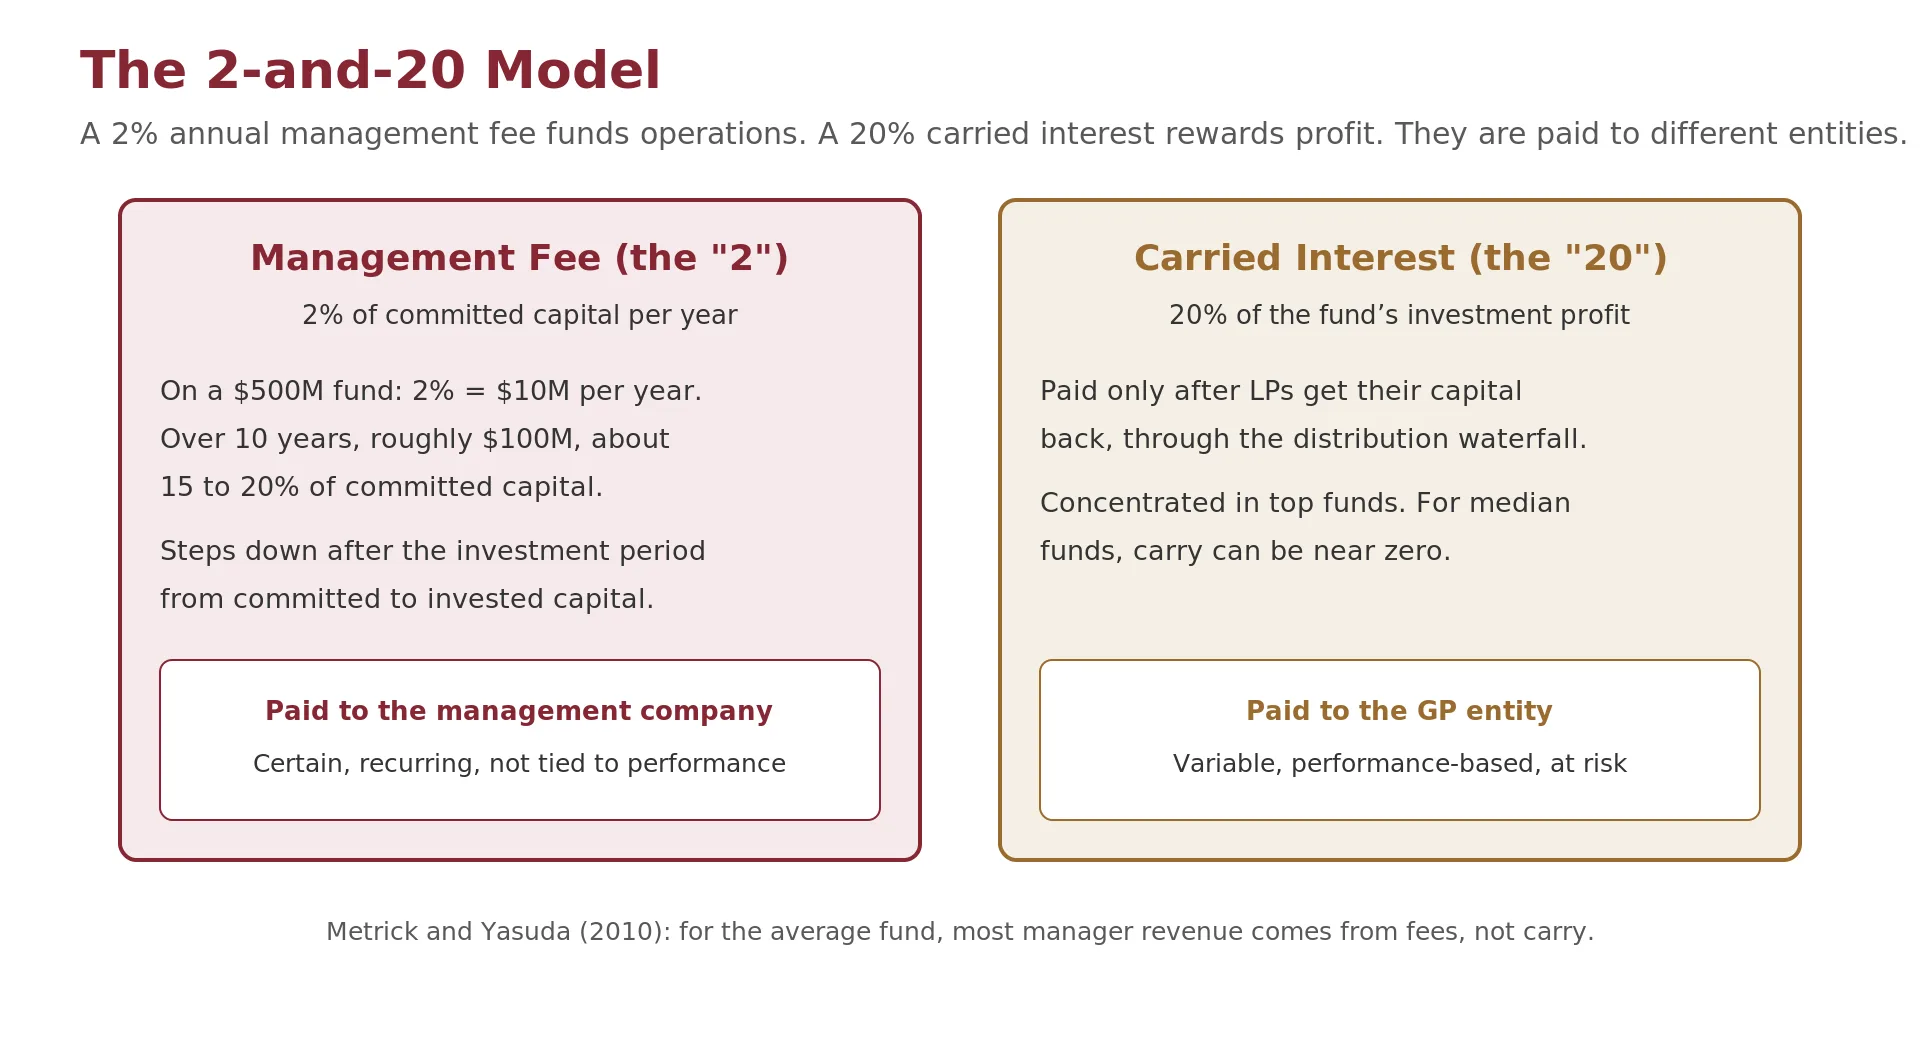
Management fees are the operating budget of the fund. A $500 million fund charging 2% generates $10 million a year, roughly $100 million, or about 20% of committed capital, over a ten-year life before a single dollar of profit is earned. Feld and Mendelson (2019) note that fees typically range from 1.5 to 2.5%, with larger funds often charging a lower percentage because the absolute dollars still cover operations. Many funds step the fee down after the investment period, from a percentage of committed capital to a percentage of invested capital.
Adjust the fund size, fee rate, fund life, carry, and gross multiple to see the management fee and carried interest move. The defaults reproduce a worked example: a $500M fund at a 2% fee earns $10M a year, about $100M over ten years, and 20% carry on a 3x gross fund is about $200M.
Check Your Understanding
Knowledge Check 4
VC Fund Economics (Fees, Carry, Waterfalls)
A $500M fund charges a 2.5% annual management fee on committed capital. What is the annual fee?
What Metrick and Yasuda Found
Metrick and Yasuda (2010) reported a striking result. For the average fund, the majority of expected manager revenue comes from fixed fees rather than carried interest, roughly two-thirds of expected revenue in their sample. This challenges the narrative that venture partners get rich from carry, since carry is concentrated in the top funds and for median and below-median funds the management fee is the primary source of income. They also found that a preferred return is far less common in venture than in buyout, appearing in about 45% of VC funds versus about 92% of buyout funds.
Check Your Understanding
Knowledge Check 5
VC Fund Economics (Fees, Carry, Waterfalls)
For the average venture fund, which statement best describes where manager compensation comes from and how common a preferred return is?
Carried Interest and the GP Commit
Carried interest is the GP's share of investment profit, typically 20%. Unlike buyout funds, many VC funds do not use a traditional 8% preferred return, so carry is often paid after the return of contributed capital, subject to the fund's waterfall and clawback provisions. Fund agreements also tend to differ on whether carry is calculated before or after management fees are returned to the LPs, so the convention that applies to any given fund is best read from its specific limited partnership agreement rather than assumed.
The GP Commit
The GP commit, the partners' own capital in the fund, is typically 1 to 5%, and LPs read a larger commit as a signal of conviction and alignment.
Part Four
The Distribution Waterfall Determines How LPs and GPs Get Paid
The distribution waterfall is the set of rules that governs how a fund's proceeds are split between the limited partners and the general partner. It is the single most important mechanic in fund economics, and it is where the abstract 2-and-20 becomes concrete dollars.
The Four Tiers of the Waterfall
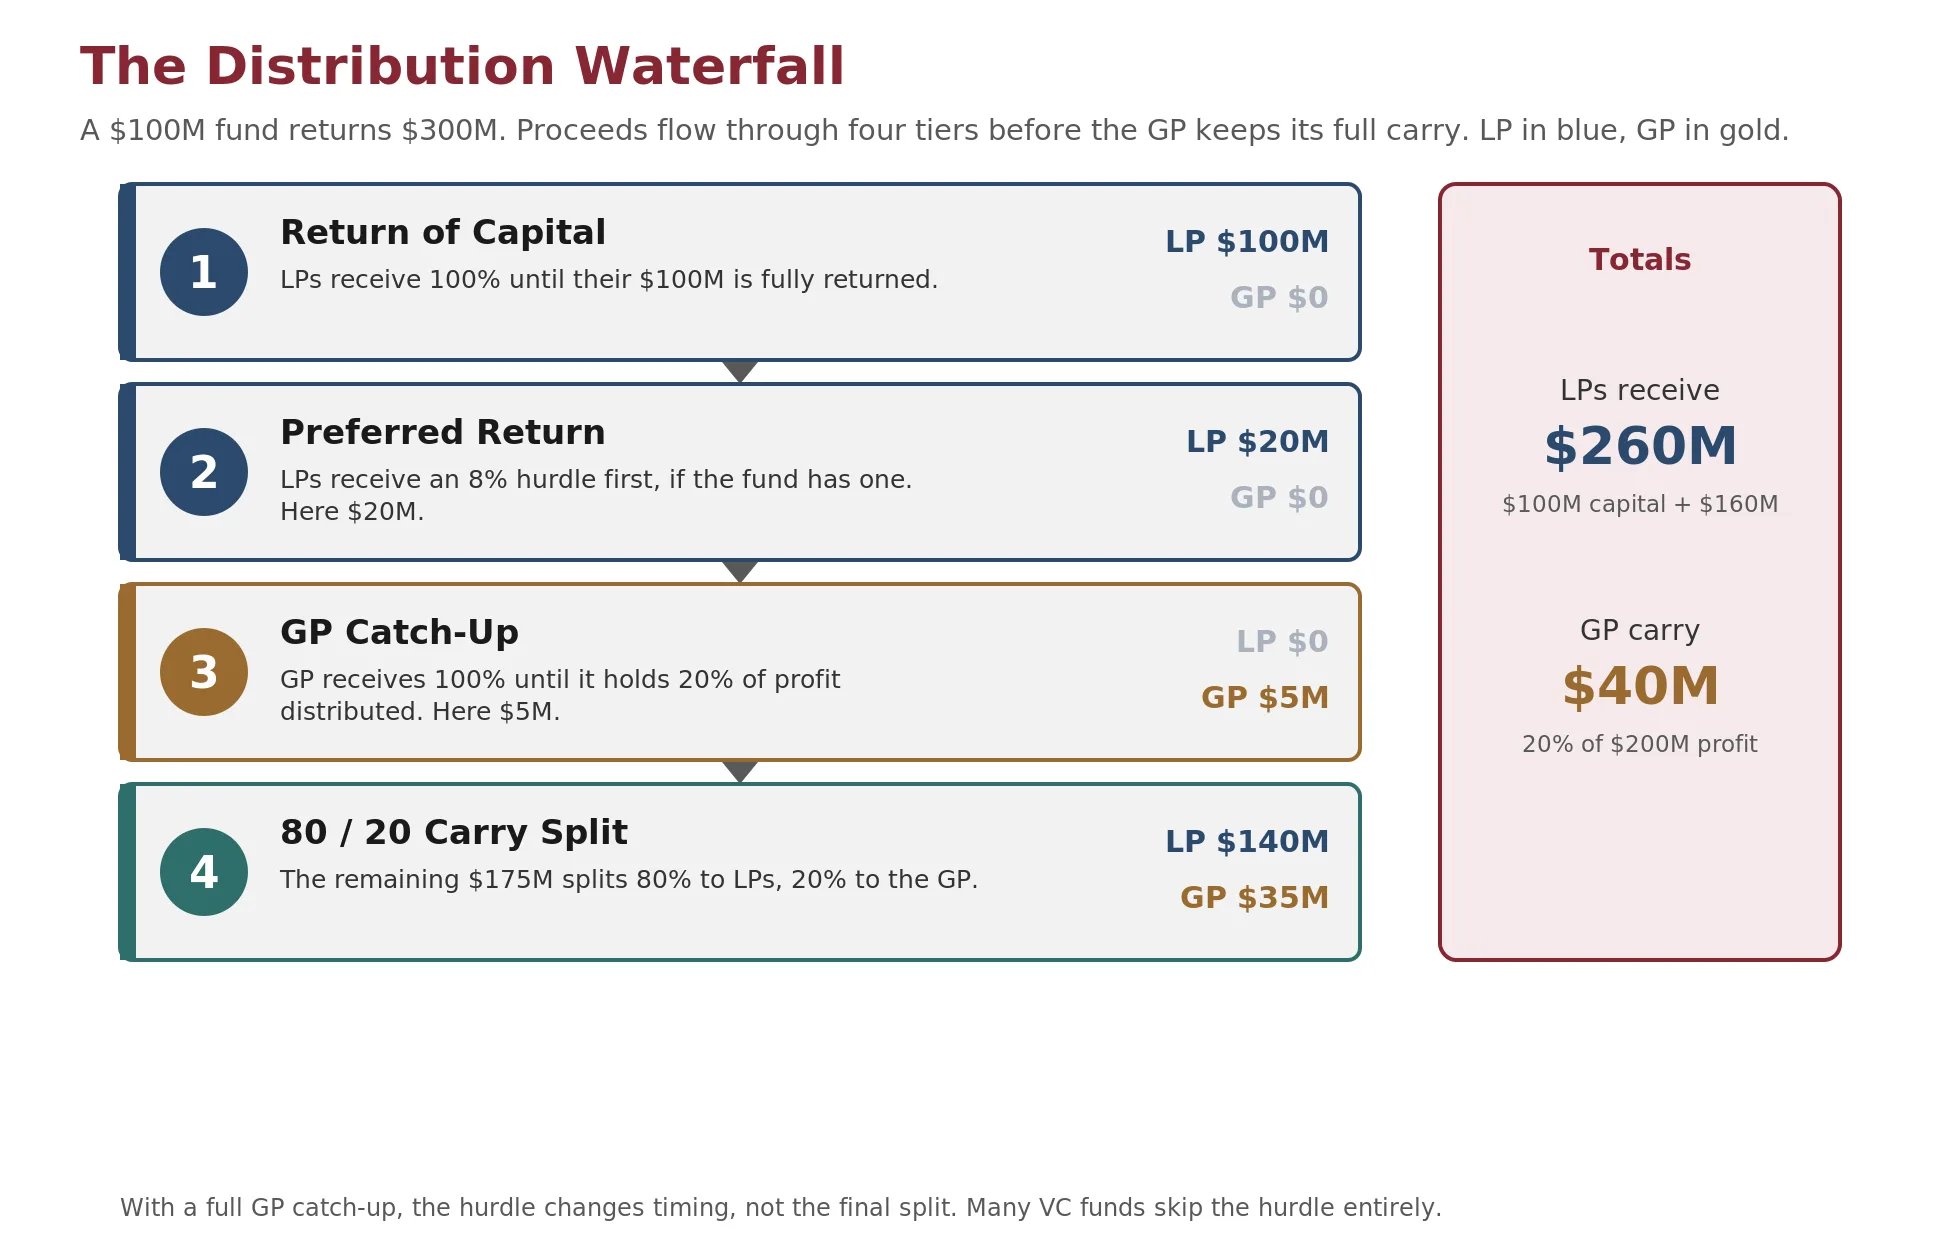
A standard waterfall has four tiers, and each is fully satisfied before the next receives anything.
| Tier | What happens |
|---|---|
| Return of capital | LPs receive distributions until they have been repaid 100% of the capital they contributed. No profit is split until the LPs have their money back. |
| Preferred return | If the fund has a hurdle, commonly 8%, LPs next receive that preferred return on their capital before the GP earns any carry. Many venture funds omit this tier entirely, which is one of the clearest differences between VC and buyout terms. |
| GP catch-up | Once the preferred return is paid, the GP receives most or all of the next distributions until it has caught up to its full carry percentage of the profit distributed so far. A full catch-up restores the GP to 20% of the profit. |
| The carry split | All remaining distributions are divided according to the carry, typically 80% to the LPs and 20% to the GP. |
A Worked Example
Consider a $100 million fund that returns $300 million over its life, a 3x gross result. The $200 million of profit is divided through the waterfall.
- Return of capital: LPs receive their $100 million of contributed capital back.
- Preferred return: with an 8% hurdle, LPs receive the accrued preferred return, here $20 million. A fund with no hurdle skips this tier.
- GP catch-up: the catch-up brings the GP to 20% of profit distributed. Solving 20% x ($20M + catch-up) = catch-up gives a $5 million catch-up, so the GP holds $5 million of the $25 million of profit distributed so far, exactly 20%.
- Carry split: the remaining $175 million splits 80/20, so LPs receive $140 million and the GP receives $35 million.
Adding the tiers, the LPs receive $260 million, which is $100 million of capital plus $160 million of profit share, and the GP receives $40 million of carried interest, which is 20% of the $200 million profit. A revealing feature emerges here. With a full catch-up, the hurdle changes the timing and order of payments but not the final 20% split. A fund with no hurdle reaches the same $260 million and $40 million directly, since there is no preferred tier to work through. A hurdle without a catch-up, by contrast, would permanently shift value to the LPs, because the GP would never recover the profit paid out as the preferred return.
Key relationship. GP catch-up solves catch-up = carry% x (preferred return + catch-up). At a 20% carry on a $20M preferred return, the catch-up is $5M, bringing the GP to 20% of the profit distributed.
Adjust the fund size, total returned, hurdle, and carry to see the LP/GP split across the four tiers. The defaults reproduce a $100M fund returning $300M (LPs $260M, GP $40M, catch-up $5M). The $20M hurdle corresponds to roughly two and a half years of an 8% simple preferred return accruing on the $100M of committed capital before the exit distributions arrive.
Check Your Understanding
Knowledge Check 6
VC Fund Economics (Fees, Carry, Waterfalls)
In a standard fund distribution waterfall, what is paid first?
Knowledge Check 7
VC Fund Economics (Fees, Carry, Waterfalls)
A $100M fund returns $350M with no preferred return. Using a 20% carry, how much does the GP receive?
American vs European Waterfalls
Two structures govern when the GP earns its carry. The European, or whole-fund, waterfall is friendlier to LPs. The GP earns no carry until the LPs have received back all of the fund's contributed capital, plus any preferred return, across the entire fund. The American, or deal-by-deal, waterfall is friendlier to the GP. It lets the GP take carry as each individual deal exits, before the whole fund's capital has been returned.
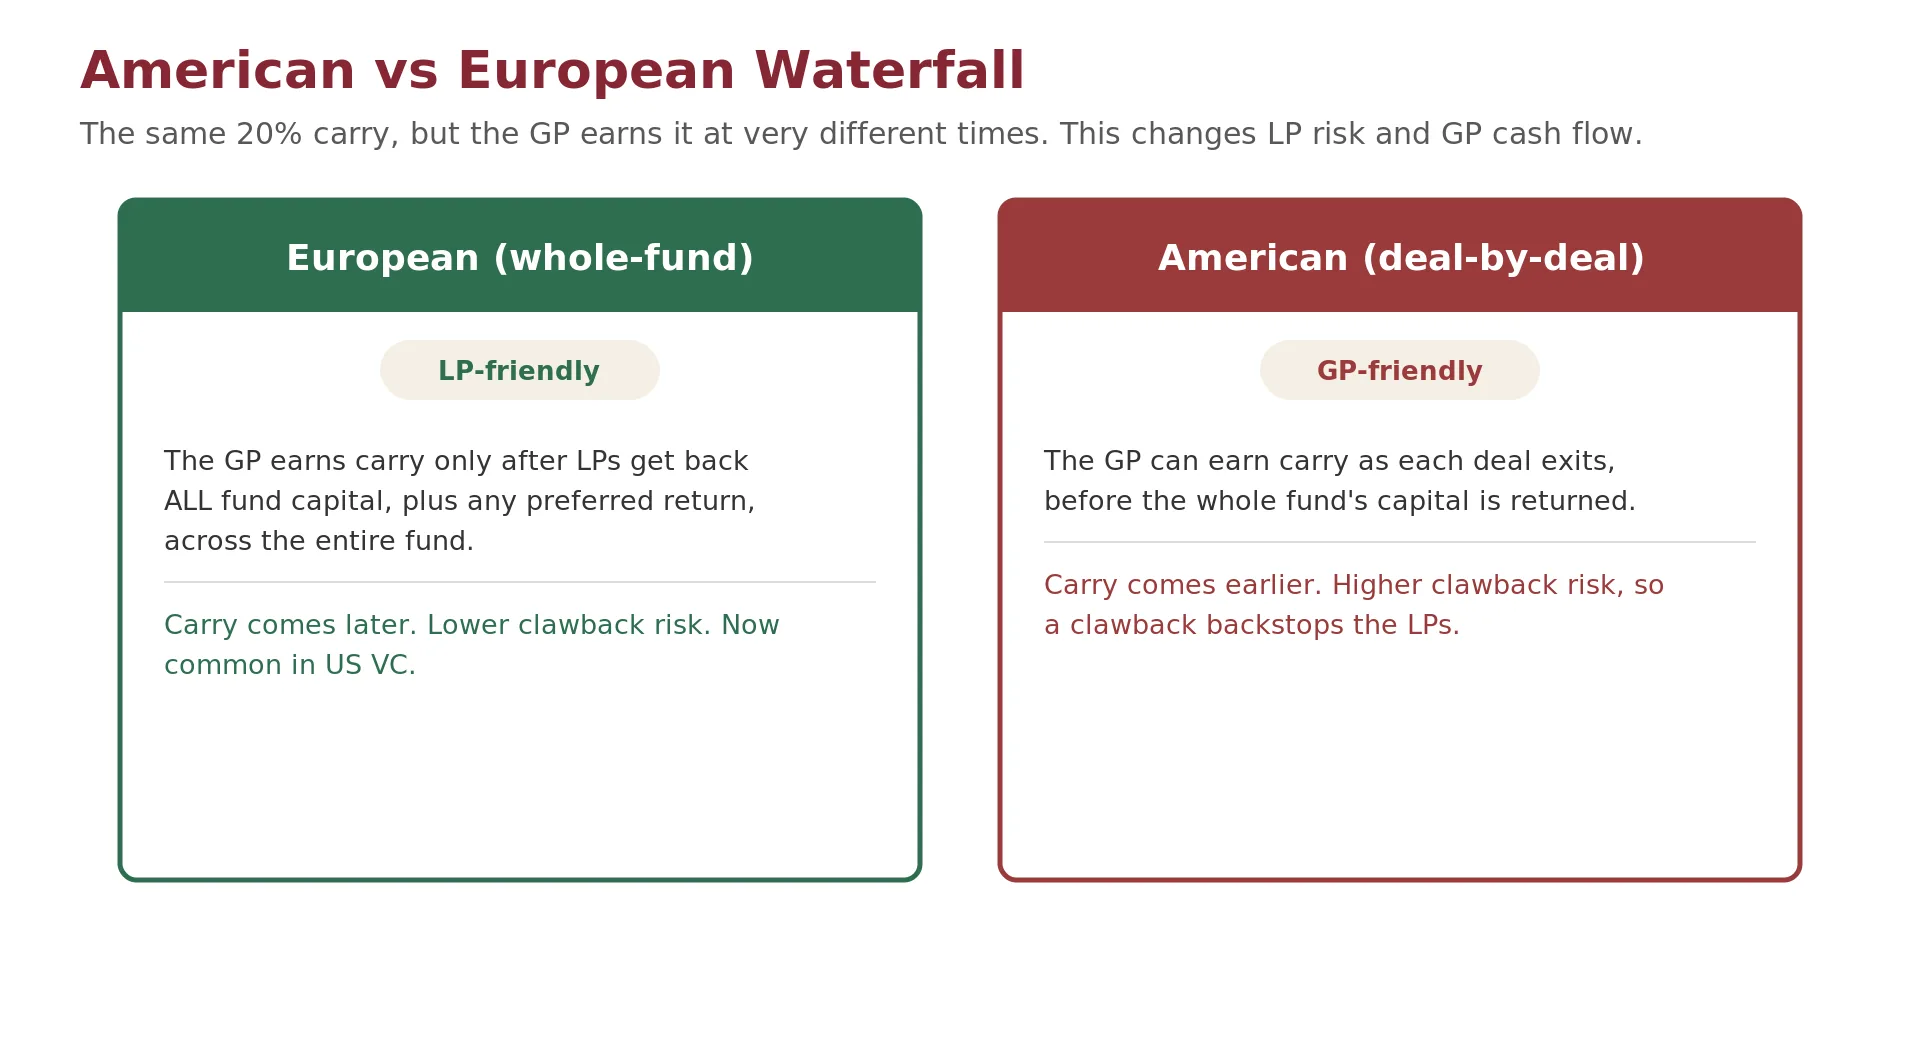
The American structure pays the GP sooner, which improves the partners' cash flow but raises the risk that early carry is overpaid if later deals disappoint. This is precisely the risk a clawback addresses. A clawback requires the GP to return excess carry to the LPs if the fund's final performance does not justify what was already distributed. Feld and Mendelson (2019) note that clawbacks are standard in fund documents but rarely enforced, both because funds structure distributions to minimize the risk and because recovering carry from individual partners is legally complex. The European waterfall reduces the need for a clawback by deferring carry until the whole fund is in profit.
Check Your Understanding
Knowledge Check 8
VC Fund Economics (Fees, Carry, Waterfalls)
How does an American (deal-by-deal) waterfall differ from a European (whole-fund) waterfall?
Part Five
A Fund Has a Lifecycle, and the J-Curve Is Real
Most venture funds follow a broadly predictable lifecycle. Gompers and Lerner (2004) formalized the venture capital cycle, describing how funds move through fundraising, investing, managing, and harvesting. Understanding the phases is valuable for anyone investing in, advising, or working at a fund.
The Commitment Period Deploys Capital; the Harvest Period Seeks Exits
The commitment period
The commitment period, often years 1 to 5, is when the fund deploys capital into new investments. Capital is not wired in a lump sum at closing. Instead the fund issues capital calls, typically with 10 to 14 days notice, as it identifies and closes deals. A $500 million fund might call 15 to 20% of commitments in year one and accelerate through years 2 to 4. Most funds also set aside 40 to 60% of committed capital as reserves for follow-on investments in their best companies, since a fund that deploys everything into initial checks tends to struggle to protect its ownership in later rounds.
The harvest period
The harvest period, often years 6 to 10 and beyond, is when the fund stops making new investments and seeks exits through acquisitions, IPOs, or secondary sales. Extensions of one to two years past the ten-year term are common and usually require LP consent.
The J-Curve Is Real
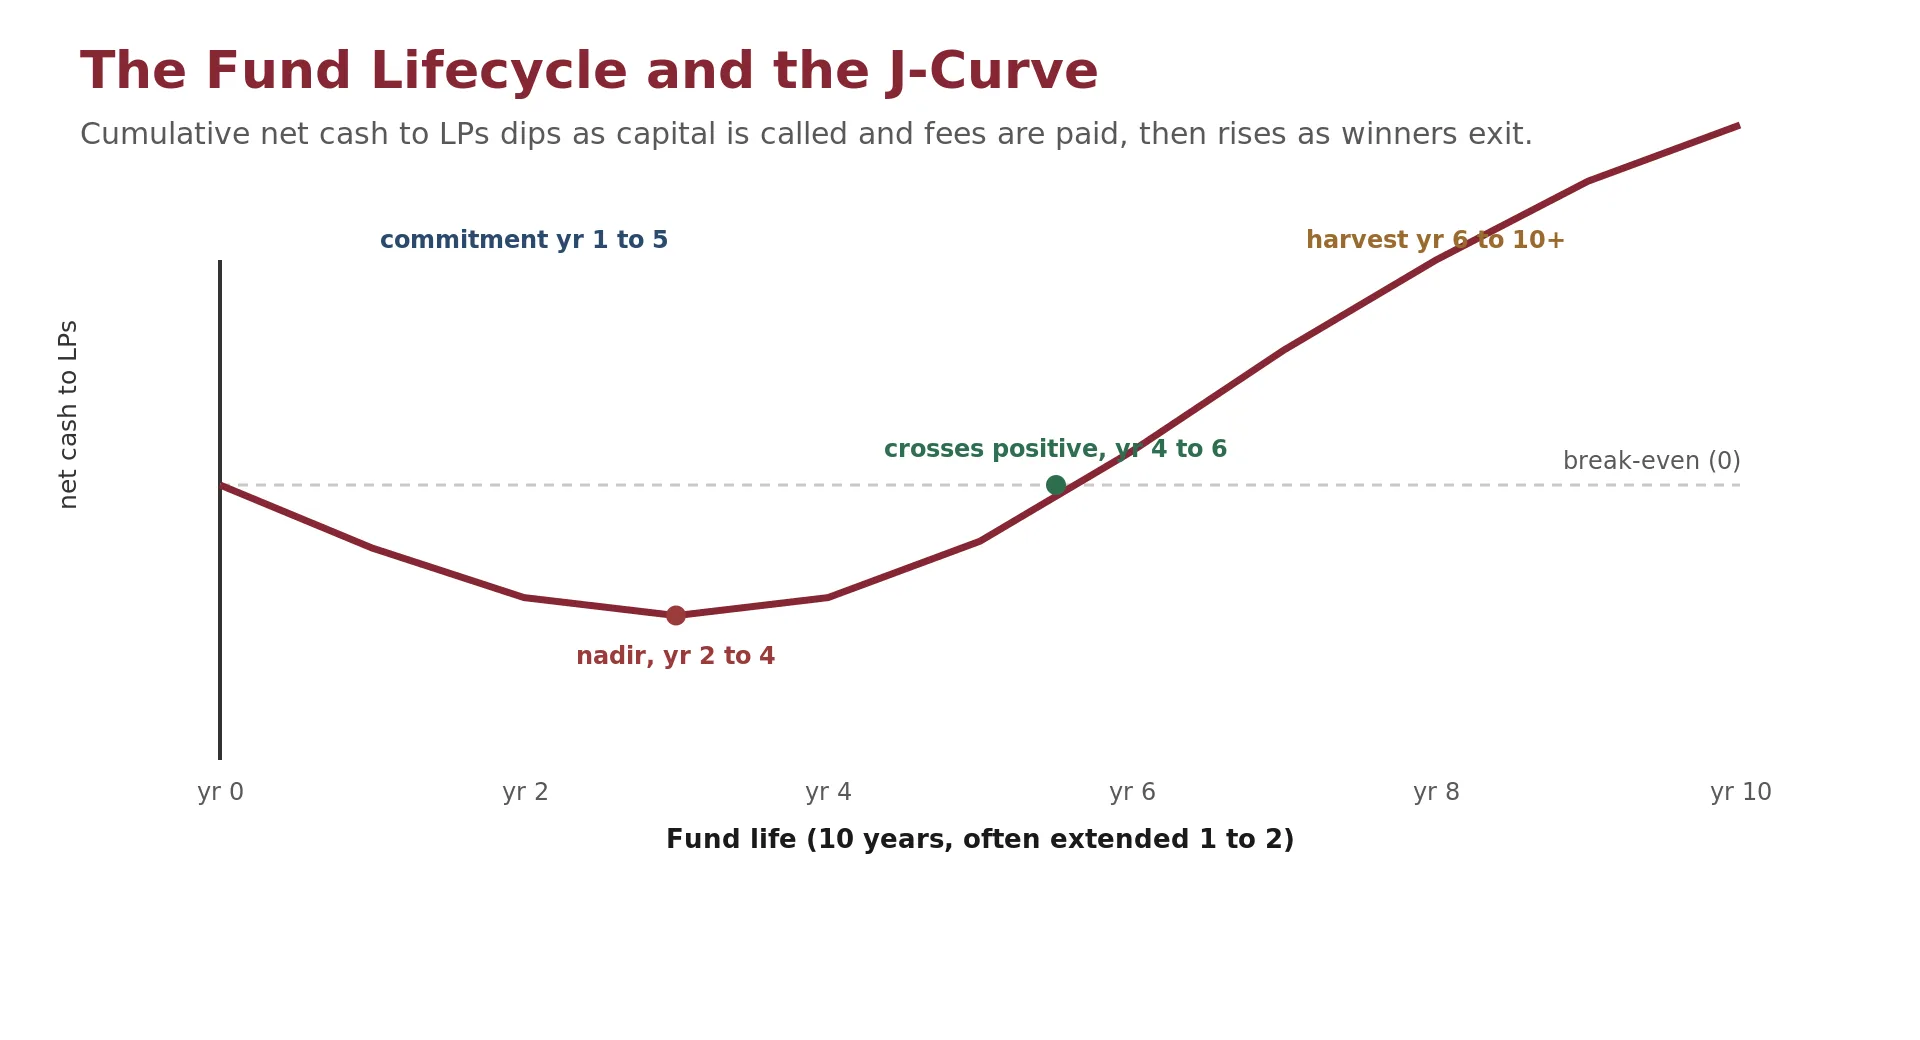
The J-curve describes the trajectory of cumulative net cash to the LPs. In the early years the fund is calling capital and paying fees while portfolio companies have not yet appreciated, so the curve dips below zero. It inflects upward as successful companies begin to exit. A healthy fund reaches its nadir in years 2 to 4 and crosses back to positive in years 4 to 6. Reading this pattern correctly helps prevent mistaking normal early-year losses for failure.
Check Your Understanding
Knowledge Check 9
Fund Returns (IRR, MOIC, J-Curve, Power Law)
Why does a fund's cumulative net cash to LPs trace a J-curve?
Part Six
Fund Performance Is Measured in Multiples and IRR
LPs and GPs track fund performance with a small set of standard metrics. Two families matter: multiples, which show how much value was created per dollar invested, and the internal rate of return, which shows how fast.
The Multiples: DPI, RVPI, and TVPI
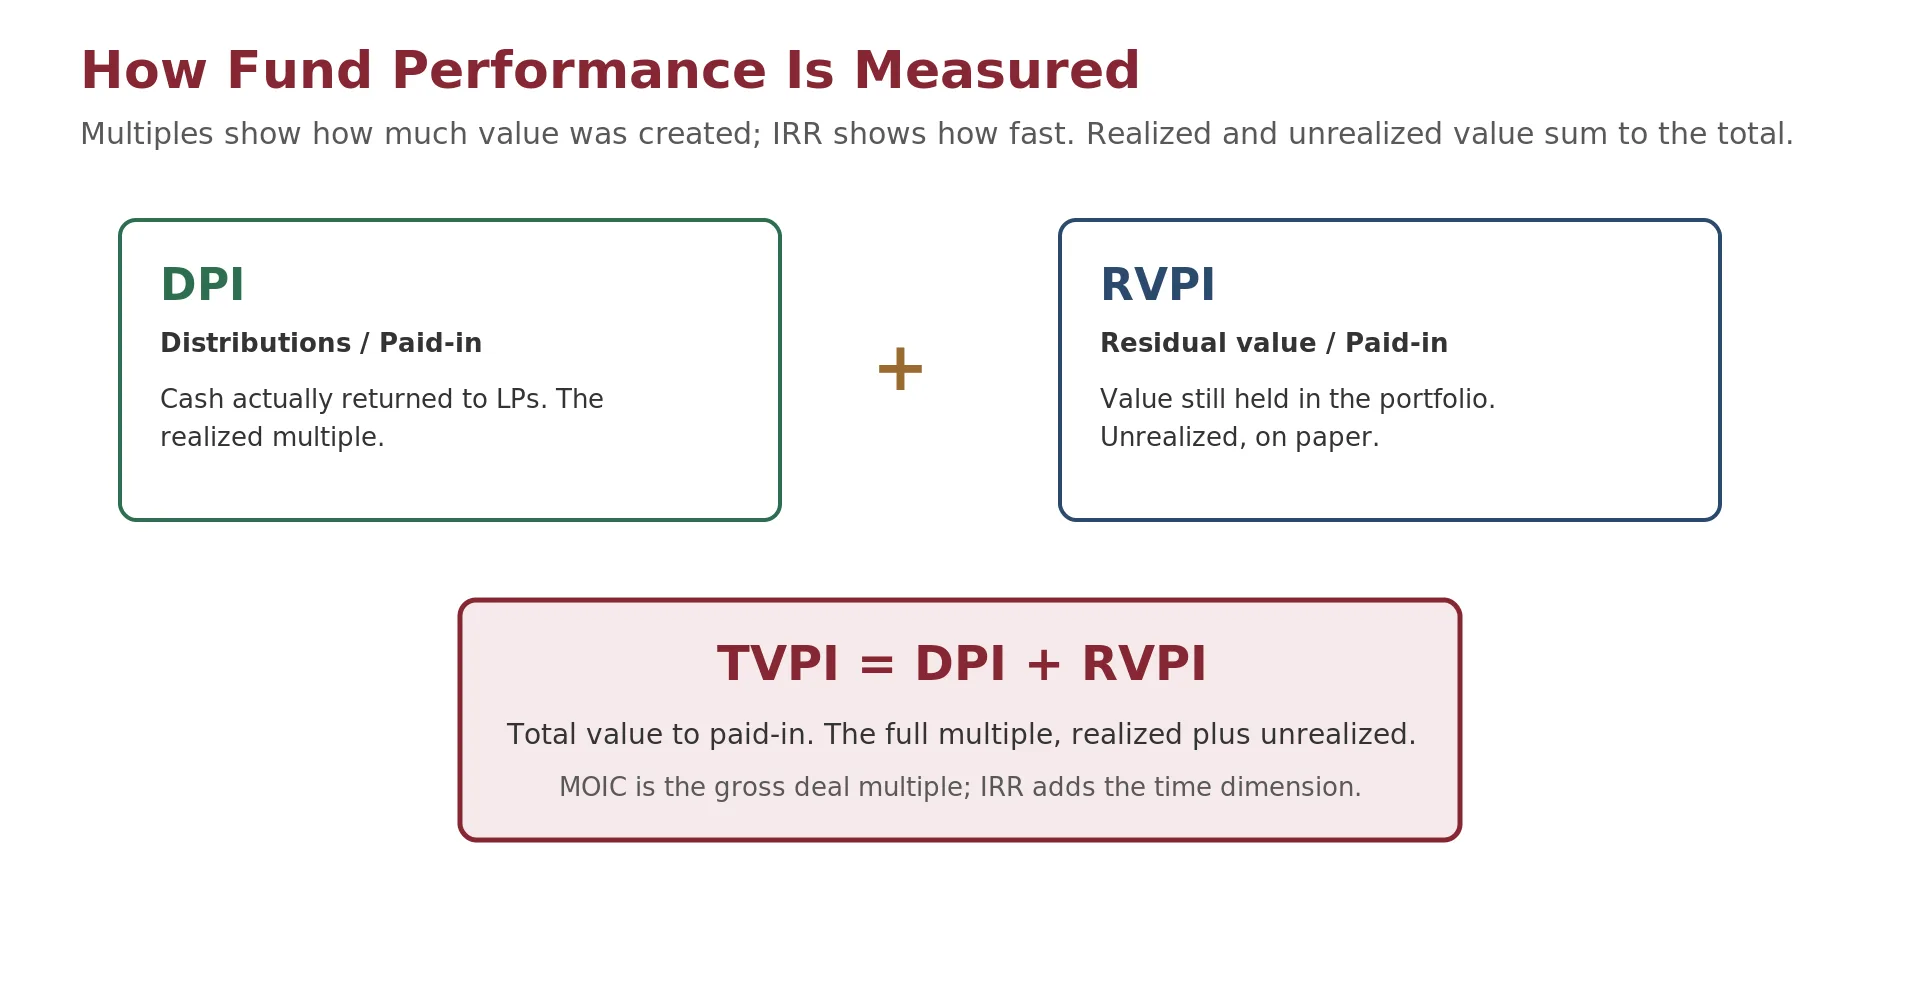
The multiples build on paid-in capital, the amount LPs have actually contributed. DPI, distributions to paid-in, measures the cash actually returned to LPs. It is the realized multiple, the one that ultimately matters, because it is money in hand. RVPI, residual value to paid-in, measures the value still held in the portfolio, the unrealized multiple that depends on marks. TVPI, total value to paid-in, is their sum, the full multiple of realized plus unrealized value.
Key relationship. TVPI = DPI + RVPI.
A fund with a DPI of 1.2x and an RVPI of 1.1x has a TVPI of 2.3x.
Enter paid-in capital, distributions, and residual value to see DPI, RVPI, and TVPI. The defaults reproduce this module's example (paid-in $100M, distributions $120M, residual $110M → DPI 1.2x, RVPI 1.1x, TVPI 2.3x).
MOIC, IRR, and Reading Them Together
MOIC, the multiple on invested capital, is a gross deal-level multiple of value created before fund fees and timing. IRR adds the dimension the multiples ignore, which is time. It is the discount rate that sets the net present value of a fund's cash flows (the capital calls flowing out and the distributions flowing back) to zero. Two funds can post the same TVPI while earning very different IRRs, because a dollar returned in year three is worth more than the same dollar returned in year nine. IRR can also be flattered by early distributions or by the timing of capital calls, so LPs read multiples and IRR together rather than trusting either alone.
Worked example
Consider a $100 million fund that calls capital evenly, $20 million a year over its five-year investment period, then returns $250 million, $50 million a year over years six through ten, a 2.5x gross multiple. The cash-flow stream is five years of −$20M followed by five years of +$50M. The rate that makes the present value of that stream zero is the fund's IRR, about 20.1%. Cumulative net cash to the LPs is the J-curve made concrete: it falls to −$100 million by the end of year five, then climbs back through zero and up to +$150 million as the distributions arrive. Now shorten the harvest to three years at the same 2.5x multiple and the IRR jumps well above 20%; stretch it to ten years and it falls below 20%. The multiple is unchanged, but the speed, and therefore the IRR, is not.
Set the committed capital, the investment period over which calls are made, the gross multiple returned, and the harvest period over which distributions arrive. The calculator solves for the fund's IRR and draws the cumulative-cash J-curve. The defaults reproduce the worked example ($100M called over 5 years, $250M returned over years 6–10 → IRR ≈ 20.1%, trough −$100M). Hold the multiple fixed and change the harvest length to see IRR move while the multiple does not.
Check Your Understanding
Knowledge Check 10
Fund Returns (IRR, MOIC, J-Curve, Power Law)
A fund has returned 1.2x of paid-in capital in cash and holds portfolio value worth another 1.5x. What is its TVPI?
Part Seven
Returns Follow a Power Law, and Persistence Separates VC
Venture returns do not cluster around an average: a handful of investments carry the entire asset class, and the funds that catch them tend to keep catching them. This part looks at the power-law shape of VC returns and at why performance persistence separates venture capital from most other asset classes.
Returns Follow a Power Law, Not a Bell Curve
Venture portfolio strategy operates under different assumptions than traditional portfolio management. The efficient frontier and the core of Modern Portfolio Theory, developed by Markowitz (1952), assume returns are approximately normal and that diversification reduces risk without proportionally reducing expected return. In venture capital, neither assumption holds.
The Horsley Bridge Evidence
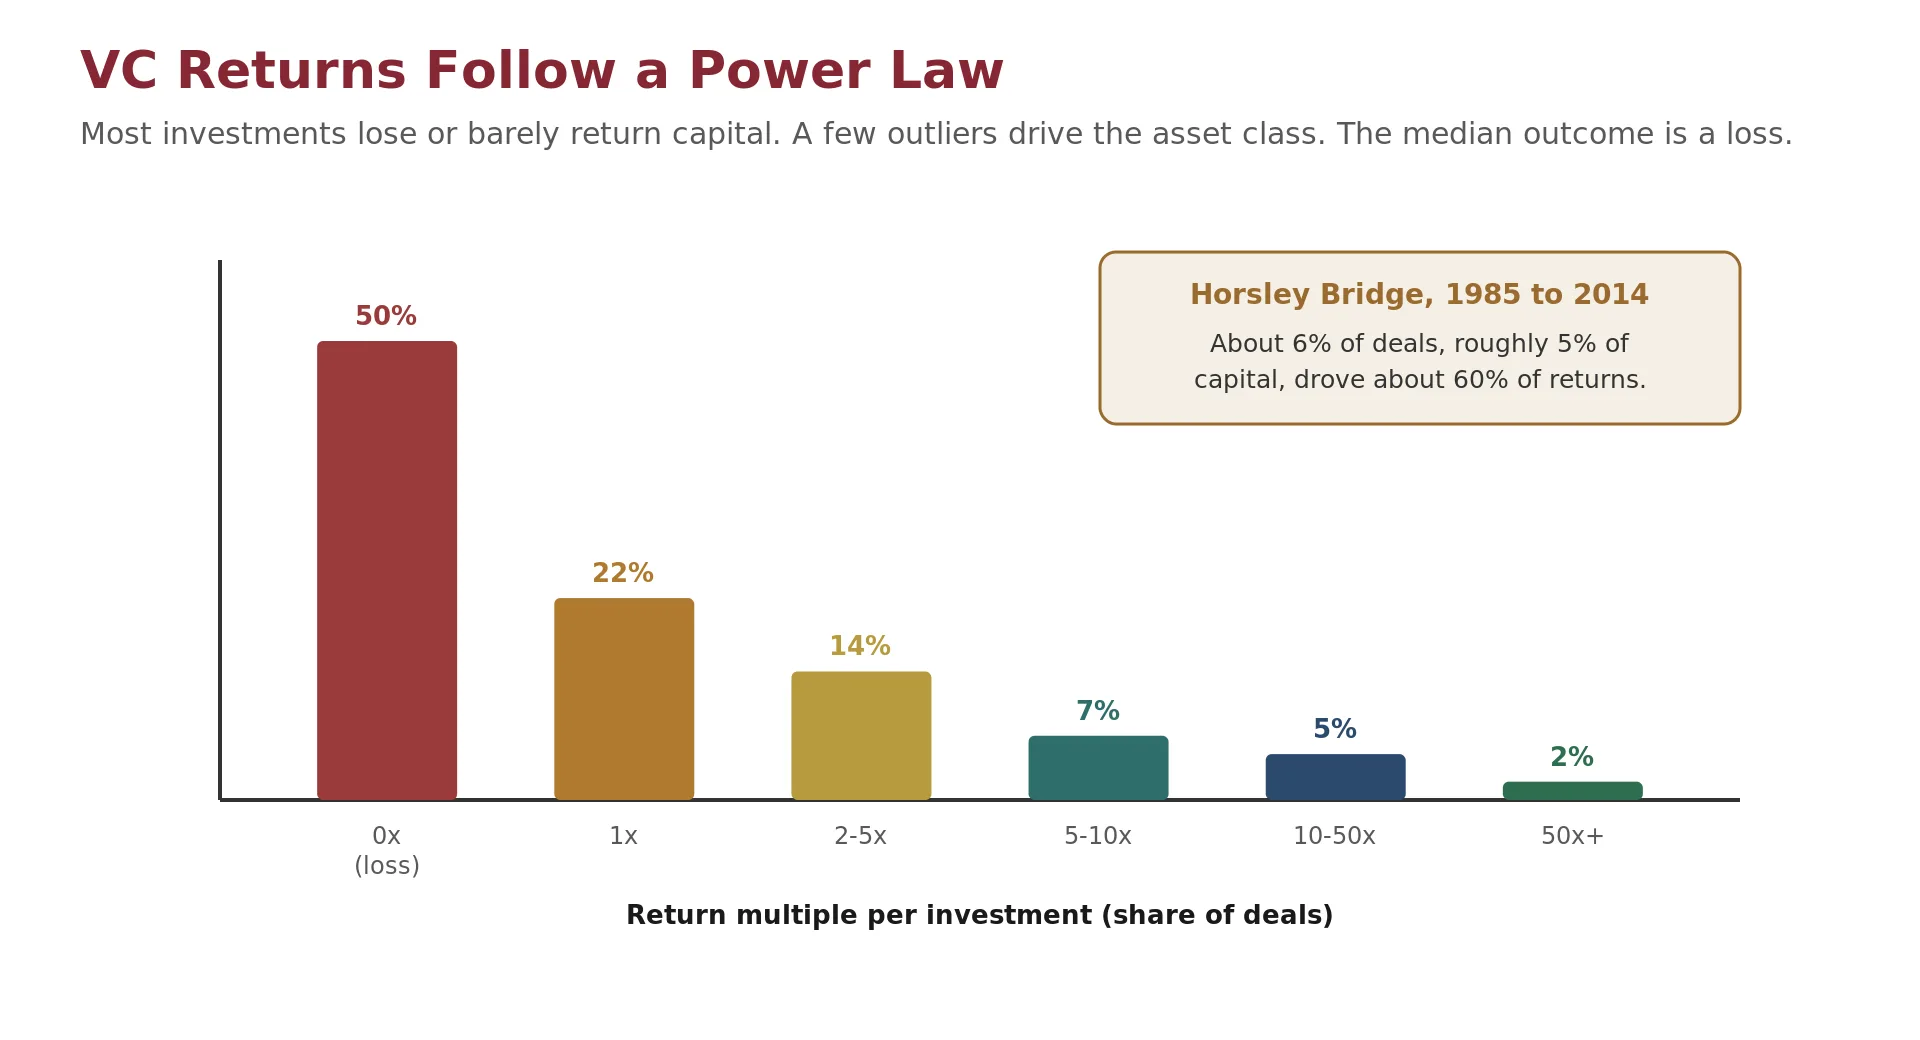
VC returns follow a power law. A small number of investments generate the vast majority of returns, and the median outcome is a loss. Data from Horsley Bridge Partners, a respected fund-of-funds, illustrates the pattern. Across U.S. VC deals from 1985 to 2014, about 6% of deals, representing roughly 5% of invested capital, generated about 60% of total returns. The remaining deals, the overwhelming majority, produced the rest.
Diversify to Catch the Tail
The implication for portfolio construction is profound. In a normally distributed asset class, an investor diversifies to smooth volatility and converge on the mean. In a power-law asset class, an investor diversifies to raise the probability of capturing an outlier. A fund making only 5 investments has a meaningful chance of missing the power-law tail entirely, while a fund making 30 has a much higher chance of catching at least one outlier, though each position is smaller and its ownership at exit is more diluted.
From Spray-and-Pray to Conviction
This is the central tension of venture portfolio strategy, the spectrum from spray-and-pray to conviction. A spray-and-pray strategy writes many small checks, taking lower ownership in each company to maximize the number of shots at an outlier. A conviction strategy writes fewer, larger checks, taking higher ownership and engaging more deeply so that a single winner returns more of the fund. Neither approach dominates; they trade breadth against ownership.
The default assumes 30 investments at a 6% outlier rate, giving about an 84% chance of catching at least one outlier, versus about 27% at only 5 investments. Adjust the number of investments and the outlier rate to see how diversification raises the probability of capturing the power-law tail.
Check Your Understanding
Knowledge Check 11
Fund Returns (IRR, MOIC, J-Curve, Power Law)
Given a power-law return distribution, why do many VC funds hold 20 to 40 investments rather than 5?
Knowledge Check 12
Fund Returns (IRR, MOIC, J-Curve, Power Law)
A large-sample analysis of U.S. venture deals from 1985 to 2014 found which pattern in returns?
Performance Persistence Separates Venture Capital
Most asset classes show little persistence. A manager who outperforms in one period is no more likely than chance to outperform in the next. Private capital is an exception, and venture capital is the strongest case. Kaplan and Schoar (2005) documented that returns persist across a general partner's successive funds, a finding unusual enough to reshape how LPs select managers.
What Later Work Sharpened
Later work sharpened the picture. Harris, Jenkinson, Kaplan and Stucke examined whether persistence survived into the post-2000 era. For buyout funds it largely faded: the probability that a top-quartile fund is followed by another top-quartile fund fell from roughly 0.42 in the earlier sample toward roughly 0.26, close to chance. For venture funds persistence held, with the top-quartile-to-top-quartile transition remaining near 0.45, statistically distinguishable from random. The persistence is attributed to reputation and network effects that lock top venture firms into the best deal flow at the seed and Series A stages.
The Practical Lesson: LP Selection
The practical lesson runs to LP selection. Because venture returns persist, access to the top-quartile firms is itself the scarce resource, and those firms are often closed to new LPs. Persistence is a tendency across many funds, not a guarantee for any single one, but it explains why LPs compete so hard for allocations to a small set of established managers.
Check Your Understanding
Knowledge Check 13
Fund Returns (IRR, MOIC, J-Curve, Power Law)
What do large-sample studies of fund performance persistence show for venture capital in the post-2000 era?
Part Eight
Accessing Venture Capital, and Careers
How investors gain exposure to venture capital as an asset class, the careers and advisory ecosystem that surround the industry, and the limits of the simplified examples used throughout this module.
Accessing Venture Capital as an Asset Class
Investors reach venture capital through several routes, each with distinct tradeoffs. The traditional route is direct LP access, committing capital to a fund as a limited partner. This offers the purest exposure but demands scale, a long lockup of ten years or more, and access to funds that are often oversubscribed.
Publicly traded alternatives
Publicly traded alternatives offer liquidity at the cost of directness. The large alternative-asset managers, including KKR, Blackstone, Apollo, Carlyle, and Ares, are publicly traded. Buying their stock gives exposure to management-fee revenue and a share of carried-interest economics, but the investor owns the management company, not the underlying funds, and the stock price reflects the firm's earnings and growth rather than any single fund's returns.
Platforms and starting a fund
Crowdfunding and syndicate platforms have opened earlier-stage access to smaller investors, allowing participation in individual deals or rolling funds. These carry their own fees and a risk of adverse selection, since the strongest deals are often filled by established investors before they reach a platform. A final route is to start a fund, which converts the investor into a general partner and subjects them to the full economics and lifecycle described in this module.
Careers and the Advisory Ecosystem
Compensation in venture capital is bifurcated. Junior roles, analyst and associate, pay less than comparable positions in banking or consulting, and the tradeoff is learning and the option value of building a network early. Senior roles, principal through general partner, are where compensation escalates, driven by carried interest. A general partner at a top-performing billion-dollar fund can earn well into the millions when carry is realized, while at a median fund carry may contribute little and compensation rests on the management fee. The variance between top-quartile and median outcomes is wider in venture than in almost any other financial career.
The advisory ecosystem
A substantial advisory ecosystem surrounds the industry. Fund-level advisory covers audit, tax, and reporting. Each fund is a separate entity requiring its own audit and partnership tax return, and the hardest judgment is valuing illiquid portfolio companies under ASC 820, since there is no market price for a Series A startup. LP reporting has grown more demanding, and the Institutional Limited Partners Association templates have become a de facto standard. Deal-level advisory covers buy-side and sell-side diligence, which becomes a formal, multi-workstream engagement by Series B and in buyout transactions.
Check Your Understanding
Knowledge Check 14
VC Fund Economics (Fees, Carry, Waterfalls)
Under Section 1061, how long must carried interest be held to qualify for long-term capital gains treatment?
Limits of This Module
This module explains how the venture capital industry and its funds are structured. It is not investment or tax advice, and fund terms, tax rules, and market figures change, so any specific number should be checked against current sources and the actual fund documents.
The worked waterfall example uses clean, rounded inputs to isolate the mechanics. Real waterfalls track each LP's capital account separately, apply the hurdle on an IRR basis, and interact with fees, recycling, and clawback provisions in ways a single example does not fully capture.
The market statistics, including assets under management, firm rankings, and the 2-and-20 convention, are a 2025 to 2026 snapshot and reflect the sources cited rather than permanent norms.
Performance and persistence findings describe historical averages across many funds. They do not predict the outcome of an individual fund, and access to top-quartile managers is itself limited.