
Week 3CHAPTER 03
Financial Statement Analysis for Startups
From unreliable data to actionable intelligence, a diligence-oriented toolkit for separating signal from noise in early-stage financials. Why startup books are unreliable by default; where revenue hides the truth (gross vs. net under ASC 606, bookings vs. billings vs. revenue vs. cash, deferred revenue); cash flow as the survival lens; the indicators that drive valuation (working capital, burn, runway, FCFF, FCFE, P/E, PEG, terminal value); unit economics by business model; vertical, horizontal, peer, and cohort analysis; driver-based forecasting; due-diligence red flags and the data room; capital structure, cap tables, and liquidation waterfalls; and reconciling the founder narrative with financial reality, with five interactive calculators.
~130 min8 sections48 questions5 tools
Learning objectives (11)
Learning Objectives
By the end of this chapter you should be able to:
- 1Evaluate the reliability of startup financial data by identifying common weaknesses in early-stage reporting, including hybrid cash/accrual accounting, incomplete records, founder bias, and unsupported financial narratives.
- 2Distinguish between bookings, billings, recognized revenue, and cash collections and explain how confusing these measures can distort analysis of startup performance and liquidity.
- 3Apply basic ASC 606 revenue recognition concepts to assess whether a startup should report revenue gross or net based on the principal-versus-agent framework.
- 4Analyze deferred revenue, customer deposits, and cash-basis reporting risks to determine whether positive cash flow reflects sustainable operations or cash pulled forward from future periods.
- 5Calculate and interpret core startup financial indicators, including working capital, burn rate, runway, FCFF, FCFE, P/E, and PEG, and explain the role of terminal value in startup valuation.
- 6Assess startup unit economics by business model, including SaaS, marketplace, consumer subscription, hardware/product, and services businesses.
- 7Use vertical, horizontal, peer, and cohort analysis to evaluate profitability structure, trends, benchmarking, retention quality, and business durability.
- 8Build the logic of a driver-based forecast by linking financial projections to operating drivers such as sales capacity, customer acquisition, retention, pricing, headcount, and cost structure.
- 9Identify common financial due diligence red flags, including revenue inflation, customer concentration, unrecorded liabilities, weak data rooms, aggressive add-backs, and unsustainable working capital trends.
- 10Explain how capital structure affects investor and founder outcomes, including the impact of SAFEs, convertible notes, preferred equity, liquidation preferences, and participation rights.
- 11Reconcile the founder narrative with financial reality by comparing the company’s story against its cash flows, operating metrics, cap table, and diligence evidence.
Part One: Why Startup Financials Are Unreliable. Section 1 of 8.
Part One · Why Startup Financials Are Unreliable
Why Startup Financials Are Unreliable
Startup Financial Data Is Unreliable by Default
Before reaching for the technical tools of financial statement analysis, internalize one uncomfortable reality: the financial data underlying most startups is incomplete, inconsistent, and frequently misleading. Most textbooks assume you begin with clean, GAAP-compliant statements. In practice, that assumption fails for the majority of early-stage companies.
Accounting teams in startups are typically non-existent, lean, or fully outsourced. The result is reporting that follows neither pure cash-basis nor pure accrual-basis accounting, but some hybrid that makes comparison across companies nearly impossible. Even when a startup hires dedicated staff, it takes time for that team to scale to reliable, standards-compliant reporting.
The problem runs deeper than resource constraints. Founders and early teams are incentivized to present their financials in the most favorable light. This is not always intentional deception; it is often self-deception. Revenue gets recognized earlier than it should. Expenses get minimized or deferred. Cash inflows are emphasized while outflows are downplayed. When revenue can be reported gross rather than net, founders often choose gross because it makes the top line look larger. The pattern is consistent: if there is a way to make the numbers look better, most early-stage teams gravitate toward it.
The Analytical Posture
Analytical posture. Assume imperfect financial information. Be skeptical about what is presented. The goal is to reach the truth of the matter, not to accept the narrative at face value.
The consequences compound. If the inputs to your models are unreliable, the forecasts built on them are distorted. Driver-based forecasts, which this module builds toward, require accurate baseline data. Garbage inputs produce garbage outputs, and bad data leads to bad decisions and worse outcomes.
There are three practical responses. First, acknowledge the limitations explicitly, and disclaim which accounting standards were and were not followed. Second, when a company approaches a funding round or acquisition, even a single-pass review by qualified accountants to produce a reasonably GAAP-compliant set of statements can sharply improve the quality of analysis. Third, at minimum, document the deviations from standard practice so investors and analysts can adjust accordingly.
A competent buy-side diligence team flags these risks and quantifies their impact throughout an investment process. A good advisor applying a finance lens to a startup tends to approach the numbers with the same skepticism. Developing that instinct is the first objective of this module.
Check Your Understanding
Knowledge Check 1
Revenue Recognition & Earnings Quality
A founder presents financials that recognize revenue at signing and emphasize cash inflows over outflows. What posture should the analyst take?
Gross Versus Net Recognition Distorts the Narrative
One of the most common and most consequential distortions in startup reporting is the choice between gross and net revenue recognition. Under ASC 606, the FASB standard governing revenue from contracts with customers, a company must determine whether it acts as a principal or an agent in each transaction. That determination controls whether revenue is reported at the full transaction amount (gross) or only the fee the company retains (net).
| Role under ASC 606 | How revenue is reported |
|---|---|
| Principal | Controls the good or service before transferring it to the customer. Reports revenue at the gross amount. |
| Agent | Arranges for another party to provide the good or service. Reports revenue at the net amount, its fee or commission only. |
Control is assessed using three indicators in ASC 606-10-55-39: primary responsibility for fulfillment, inventory risk before transfer, and discretion in setting prices. These are indicators, not a checklist, and no single one is determinative; they inform the underlying assessment of control.
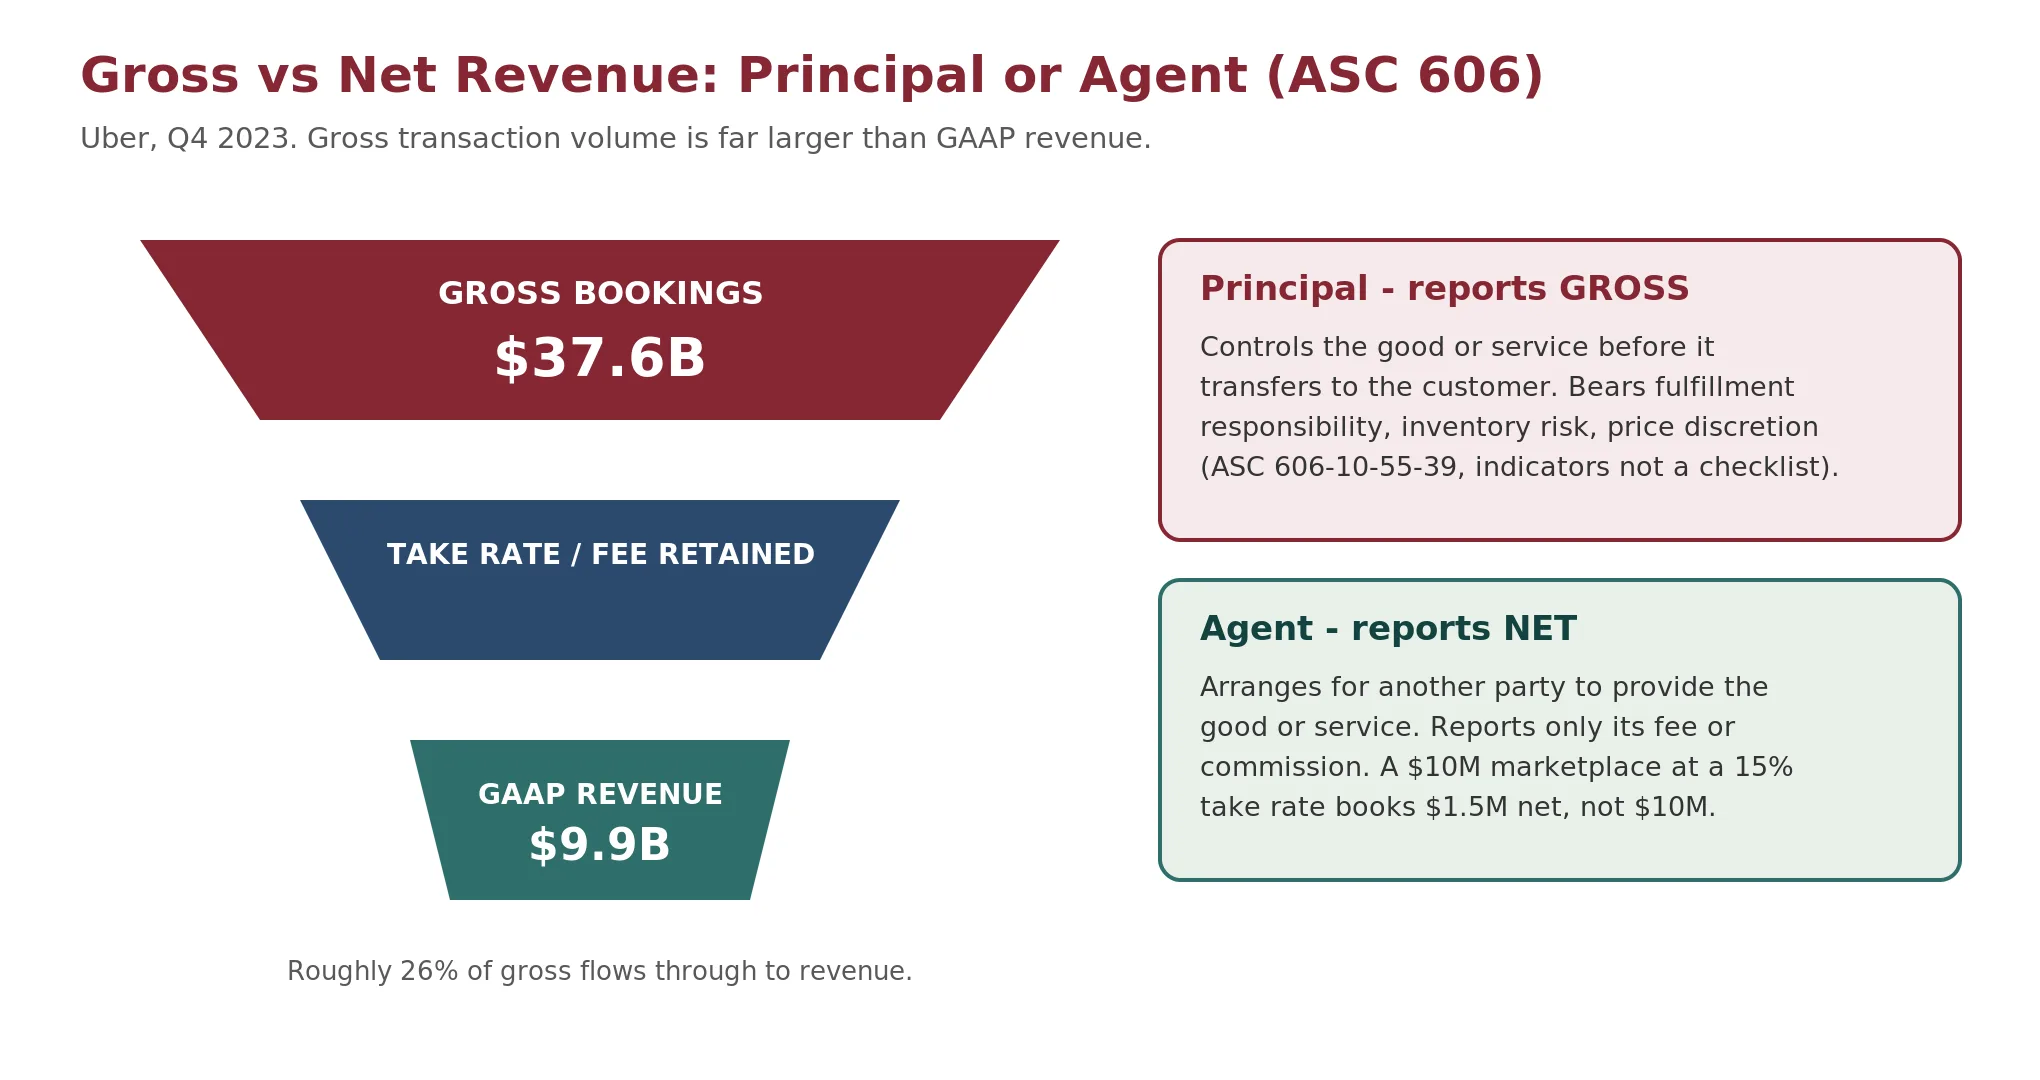
The distinction matters enormously. A marketplace that processes $10 million in gross transactions but retains a 15% take rate has $1.5 million in net revenue. Reporting $10 million versus $1.5 million tells a very different story to investors, even though net income is the same either way. Uber illustrates the gap between gross transaction volume and GAAP revenue: it reported $37.6 billion in gross bookings in Q4 2023 but only $9.9 billion in GAAP revenue. The principal-agent analysis under ASC 606 is one reason platform revenue can be far below total transaction volume.
Founders who report gross when they should report net are not necessarily committing fraud, but they are creating a misleading picture of scale. In diligence, this is one of the first things a quality-of-earnings analysis flags. As a matter of routine, ask a startup how it recognizes revenue and whether it has evaluated the principal-versus-agent determination. If it has not, that is a red flag about accounting maturity.
Check Your Understanding
Knowledge Check 2
Revenue Recognition & Earnings Quality
A platform books $10 million in transactions and keeps a 15% fee. It does not control the good before transfer. Under ASC 606, it should report revenue of:
Bookings, Billings, Revenue, and Cash Are Four Different Numbers
A common source of confusion, especially in SaaS and subscription businesses, is the distinction between bookings, billings, revenue, and cash collections. These four can produce very different numbers in the same period, and conflating them leads to flawed analysis.
| Concept | Definition and what it indicates |
|---|---|
| Bookings | The total value of signed contracts in a period, regardless of billing or recognition. Indicates demand. |
| Billings | The amount invoiced to customers in a period. Indicates invoicing cadence. |
| Revenue | The amount recognized under ASC 606 as the performance obligation is satisfied. Indicates delivery. |
| Cash collections | The cash actually received from customers in a period. Indicates whether the company has the money. |
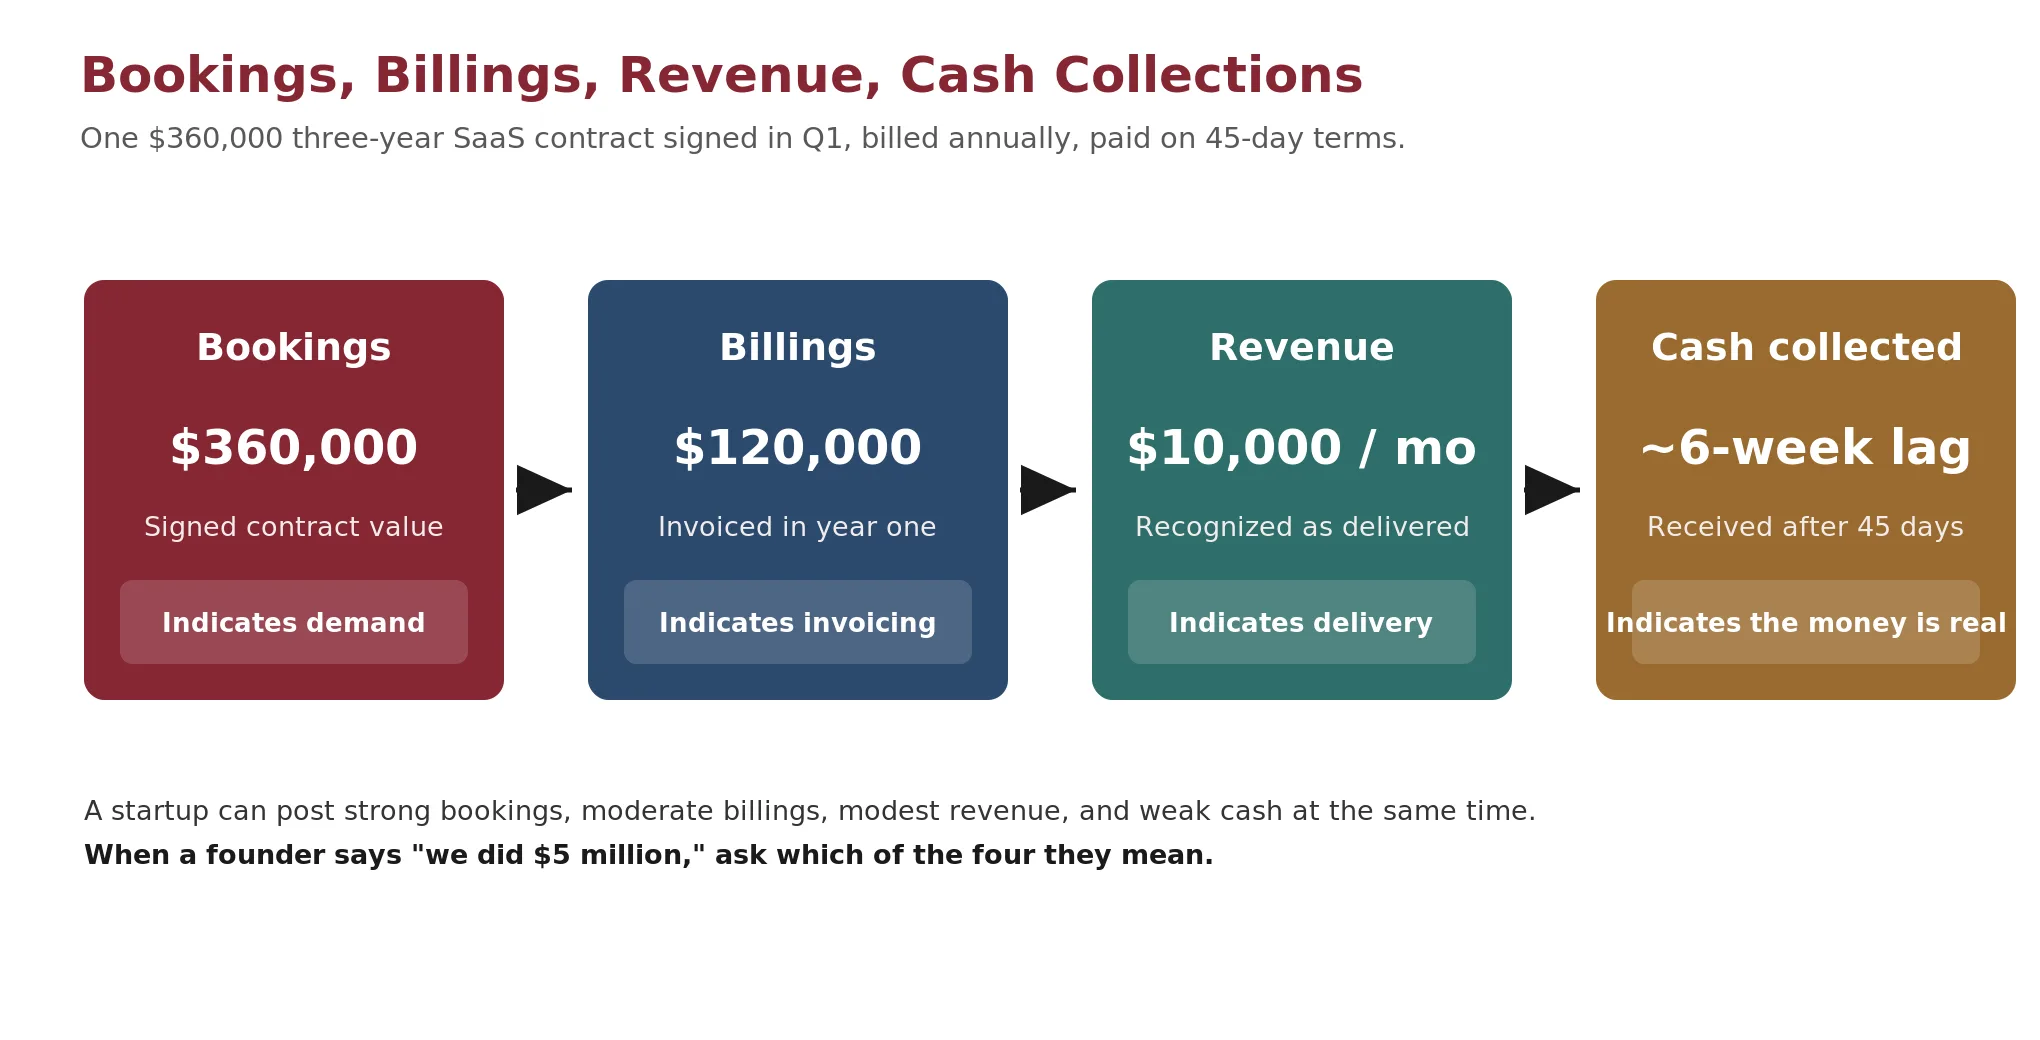
Worked example: one contract, four numbers
A SaaS vendor signs a $360,000 three-year contract in Q1, bills it annually, recognizes it ratably, and collects on 45-day terms. Watch how the same deal produces four different figures in year one.
| Figure | Year 1 amount | Timing |
|---|---|---|
| Bookings | $360,000 | Recorded in full in Q1 at signing |
| Billings | $120,000 | Invoiced at the start of year 1 |
| Revenue | $120,000 ($10,000 / month) | Recognized evenly across 12 months |
| Cash collected | $120,000, about 6 weeks after billing | Received on 45-day terms |
In Q1 alone, bookings are $360,000, but recognized revenue is only $30,000 (three months at $10,000) and cash may be near zero until the first invoice clears. A startup can post strong bookings, moderate billings, modest revenue, and weak cash at the same time. When a founder says the company did $5 million last quarter, ask which of the four they mean. The answer changes the analysis.
Check Your Understanding
Knowledge Check 3
Revenue Recognition & Earnings Quality
A founder says the company 'did $5 million last quarter.' Which figure most directly shows whether the company actually has the money?
Deferred Revenue and Customer Deposits Distort Cash Flow
Deferred revenue arises when a company receives cash before it has delivered the corresponding product or service. Under accrual accounting, that cash is recorded as a liability on the balance sheet, not as revenue on the income statement. Revenue is recognized only as the performance obligation is fulfilled.
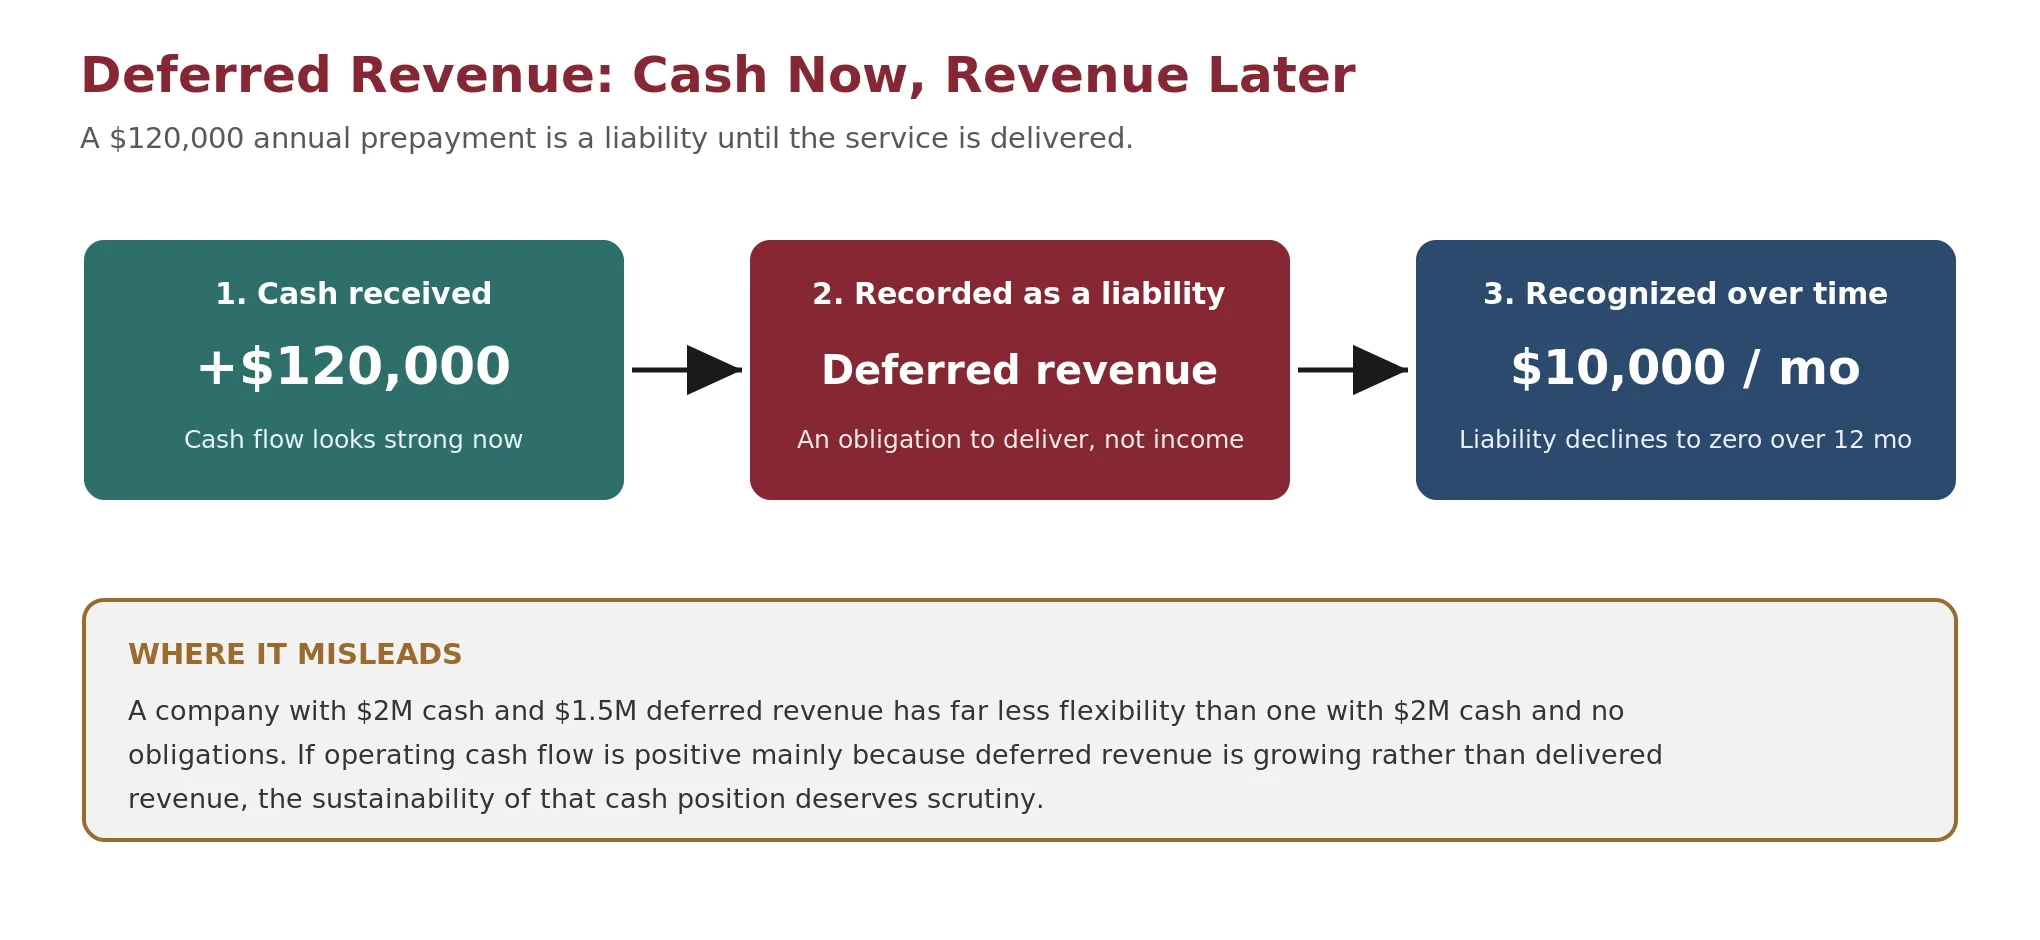
For startups, deferred revenue is a double-edged indicator. A growing balance signals strong demand and willingness to prepay. It also represents an obligation to deliver, and if the company cannot fulfill it, the cash may need to be returned. A company with $2 million in cash and $1.5 million in deferred revenue has far less flexibility than one with $2 million in cash and no deferred obligations.
Customer deposits operate similarly. A startup that collects large deposits upfront to fund development is borrowing from future delivery. The cash flow statement looks strong, but the balance sheet carries a growing liability. It is worth examining the deferred revenue trend alongside cash flow. If cash flow is positive primarily because deferred revenue is growing rather than delivered revenue is growing, the sustainability of that cash position deserves scrutiny.
Check Your Understanding
Knowledge Check 4
Revenue Recognition & Earnings Quality
A startup's operating cash flow is positive, but the gain is driven by a fast-growing deferred revenue balance. This indicates that:
Cash Flow Is the Primary Survival Lens
Given that robust GAAP-compliant statements are hard to obtain for most early-stage companies, cash flow analysis becomes the primary tool for assessing viability. This does not make GAAP optional. GAAP is the framework startups should mature into, and accrual reporting captures economic reality that cash-basis reporting does not. Cash flow analysis complements GAAP by helping you see around the unreliable accruals and incomplete reporting that characterize early-stage companies.
Cash flow is the ultimate arbiter of survival. A company can show positive revenue under its business model and still fail if its cash flow is negative. Many early businesses run on purely cash-basis books at first, then convert to accrual GAAP as they mature, usually when a funding round, acquisition, or banking relationship demands it. During the cash-basis phase, the analysis focuses on cash inflows from sales measured against the related cash outflows for cost of revenue, operating expenses, and capital expenditures.
Part Four
The Indicators That Drive Valuation
Once you have a reliable view of a startup's cash flows, compute the indicators that drive valuation and investment decisions. The following are the most critical in the entrepreneurial finance context.
Free Cash Flow to the Firm (FCFF)
Formula. FCFF = EBIT x (1 - Tax Rate) + Depreciation & Amortization - Capital Expenditures - Increase in Net Working Capital
FCFF measures the cash available to all capital providers, debt and equity, after the company reinvests in operations. Damodaran (2012) describes FCFF as a pre-debt cash flow: the cash that would be available to equity investors if the firm had no debt. For startups, FCFF is the clearest measure of whether the core business generates cash independent of financing. Note the sign convention: an increase in net working capital consumes cash, because the company ties up more money in receivables or inventory, while a decrease releases cash.
Free Cash Flow to Equity (FCFE)
Formula. FCFE = Net Income + Depreciation & Amortization - Capital Expenditures - Increase in Net Working Capital + Net Borrowing
FCFE measures the cash available specifically to equity holders after operating expenses, reinvestment, and debt obligations. Damodaran (2012) defines FCFE as the cash a business generates after taxes, reinvestment, and debt payments. Net borrowing reflects new debt issued minus principal repaid. For startups with debt financing, this is the number that tells equity investors what is actually available to them.
Worked example: FCFF and FCFE from one startup
A startup reports EBIT of $2.0 million at a 25% tax rate. Non-cash depreciation and amortization is $0.3 million, capital expenditures are $0.5 million, net working capital increased by $0.2 million, interest expense is $0.2 million, and net borrowing is $0.4 million.
| Step | FCFF | FCFE |
|---|---|---|
| Starting profit | EBIT x (1 - 0.25) = $1.50M | Net income = ($2.0M - $0.2M) x 0.75 = $1.35M |
| + D&A | + $0.30M | + $0.30M |
| - Capital expenditures | - $0.50M | - $0.50M |
| - Increase in working capital | - $0.20M | - $0.20M |
| + Net borrowing | not included (pre-debt) | + $0.40M |
| = Result | $1.10M | $1.35M |
The most common student error is the working-capital sign. The $0.2 million increase in net working capital is a use of cash, so it is subtracted in both formulas. FCFF stops before financing; FCFE then adds net borrowing to show what reaches equity.
Adjust EBIT, tax, D&A, CapEx, and the working-capital change to see FCFF and FCFE move. The defaults reproduce the worked example above.
Check Your Understanding
Knowledge Check 6
Financial Statements & Cash Flow
In the FCFF formula, how does an increase in net working capital affect free cash flow?
Knowledge Check 7
Financial Statements & Cash Flow
What does free cash flow to equity (FCFE) reflect that free cash flow to the firm (FCFF) does not?
Working Capital
Formula. Working Capital = Current Assets - Current Liabilities
Working capital measures short-term liquidity. For startups, it is often the difference between surviving the next quarter and running out of cash. In acquisitions, the normalized level becomes the working capital peg in the purchase agreement, so neither buyer nor seller is advantaged by unusual fluctuations around closing.
Cash Burn Rate and Runway
Formula. Cash Burn Rate = Cash Outflows - Cash Inflows (per month) | Runway = Cash on Hand / Monthly Net Burn
Burn rate is the excess of cash outflows over inflows in a period, usually monthly. For pre-revenue or early-revenue startups, it is the single most watched metric because it determines runway. Burn tends to grow as companies scale, so the trajectory matters as much as the current number. Dividing available cash by monthly burn yields runway in months, the countdown to either profitability or the next funding requirement.
Enter cash on hand, monthly spend, current revenue, and a monthly revenue growth rate. The calculator returns your net burn and runway in months, plus Paul Graham's Default Alive / Default Dead verdict: whether growth reaches profitability before the cash runs out.
Check Your Understanding
Knowledge Check 8
Runway, Burn & Financing Need
A pre-revenue startup holds $1.8 million in cash and burns $150,000 net per month. What is its runway?
Valuation Ratios for Profitable Startups
For startups that have reached profitability, two ratios become relevant.
Formula. P/E = Market Price per Share / Earnings per Share | PEG = P/E / Annual EPS Growth Rate
The P/E ratio compares market valuation to current earnings; a high P/E implies expectations of significant future growth. The PEG ratio adjusts P/E for growth. Because most startup value is embedded in future growth rather than current earnings, PEG is often more informative than P/E alone. A PEG below 1.0 is a common heuristic for a stock that may be undervalued relative to its growth, not a precise rule.
Enter price, EPS, and the annual EPS growth rate to compute P/E and PEG. The defaults trade at a P/E of 40 with 50% growth, giving a PEG of 0.8.
Check Your Understanding
Knowledge Check 9
Valuation & DCF
A profitable startup trades at a P/E of 40 and grows earnings at 50% per year. Its PEG ratio, and the usual reading, are:
Terminal Value
Terminal value captures the value of all cash flows beyond the explicit forecast period. Week 5 covers it in depth when we apply discounted cash flow theory, using the Gordon Growth Model (Gordon, 1962) to discount future cash flows to present value. For now, understand that terminal value typically represents the majority of a startup's total valuation, precisely because most of a startup's value lies in future growth rather than current operations.
Unit Economics Vary by Business Model
Financial statement analysis for startups is incomplete without the operating metrics specific to each business model. The same startup generating $5 million in revenue is evaluated on entirely different metrics depending on whether it is a SaaS platform, a marketplace, a consumer subscription, a hardware company, or a services business. These are the metrics you will meet in pitch decks and board materials, and they are the drivers that feed the financial models built later.
| Business model | Key operating metrics |
|---|---|
| SaaS | ARR, MRR, ACV, churn, net revenue retention (NRR), gross revenue retention (GRR), CAC, LTV, CAC payback, logo retention |
| Marketplace | GMV, take rate, contribution margin, liquidity (match rate), repeat usage, supply and demand concentration |
| Consumer subscription | Paid conversion rate, retention cohorts, ARPU, churn rate, CAC payback period |
| Hardware / product | Gross margin, inventory turns, working capital cycle, warranty exposure, contribution margin per unit |
| Services / agency | Utilization rate, average bill rate, margin by project, revenue concentration, contractor versus employee mix |
The Metrics That Matter, Defined
The metrics above connect statement analysis to the actual drivers of a business. The most important, defined briefly here and in full in the glossary:
- ARR and MRR: the annual and monthly run-rate of recurring subscription revenue. The base that expansion and churn act on.
- Net revenue retention (NRR): revenue kept and expanded from existing customers, net of churn. Above 100% means the base grows without new sales; a company at 120% NRR is fundamentally different from one at 85% at the same ARR.
- Gross revenue retention (GRR): revenue kept before expansion. By definition it cannot exceed 100%, and it exposes churn that NRR can hide.
- CAC, LTV, and CAC payback: the cost to acquire a customer, the gross profit they generate over their life, and the months of contribution needed to recover that cost.
- GMV and take rate: for marketplaces, gross transaction value and the fee retained. A marketplace with high GMV but a 5% take rate has a very different cost structure than one at 25%.
- ARPU and utilization: average revenue per user for consumer models, and billed hours as a share of available hours for services, the primary services profit lever.
The statements alone rarely reveal these dynamics. A SaaS company with $10 million ARR and 120% NRR is in a fundamentally different position than one with the same ARR and 85% NRR, even though a single period's income statement may look identical. You need the operating metrics to understand the economics.
Adjust revenue per customer, gross margin, churn, and acquisition spend to see CAC, LTV, CAC payback, and the LTV:CAC ratio move. These are the same unit-economics levers that separate a viable model from an unviable one.
Check Your Understanding
Knowledge Check 10
Unit Economics & LTV/CAC
Two SaaS companies each report $10 million ARR. One has 120% net revenue retention; the other has 85%. The difference tells you that:
Cohort Analysis Reveals What Aggregate Numbers Hide
Aggregate revenue can mask serious retention problems. A startup growing 30% year over year might look healthy, but if each cohort decays 40% within 12 months and growth is entirely from new acquisition, the business is on a treadmill. Cohort analysis groups customers by the period in which they were acquired and tracks their revenue or usage over time.
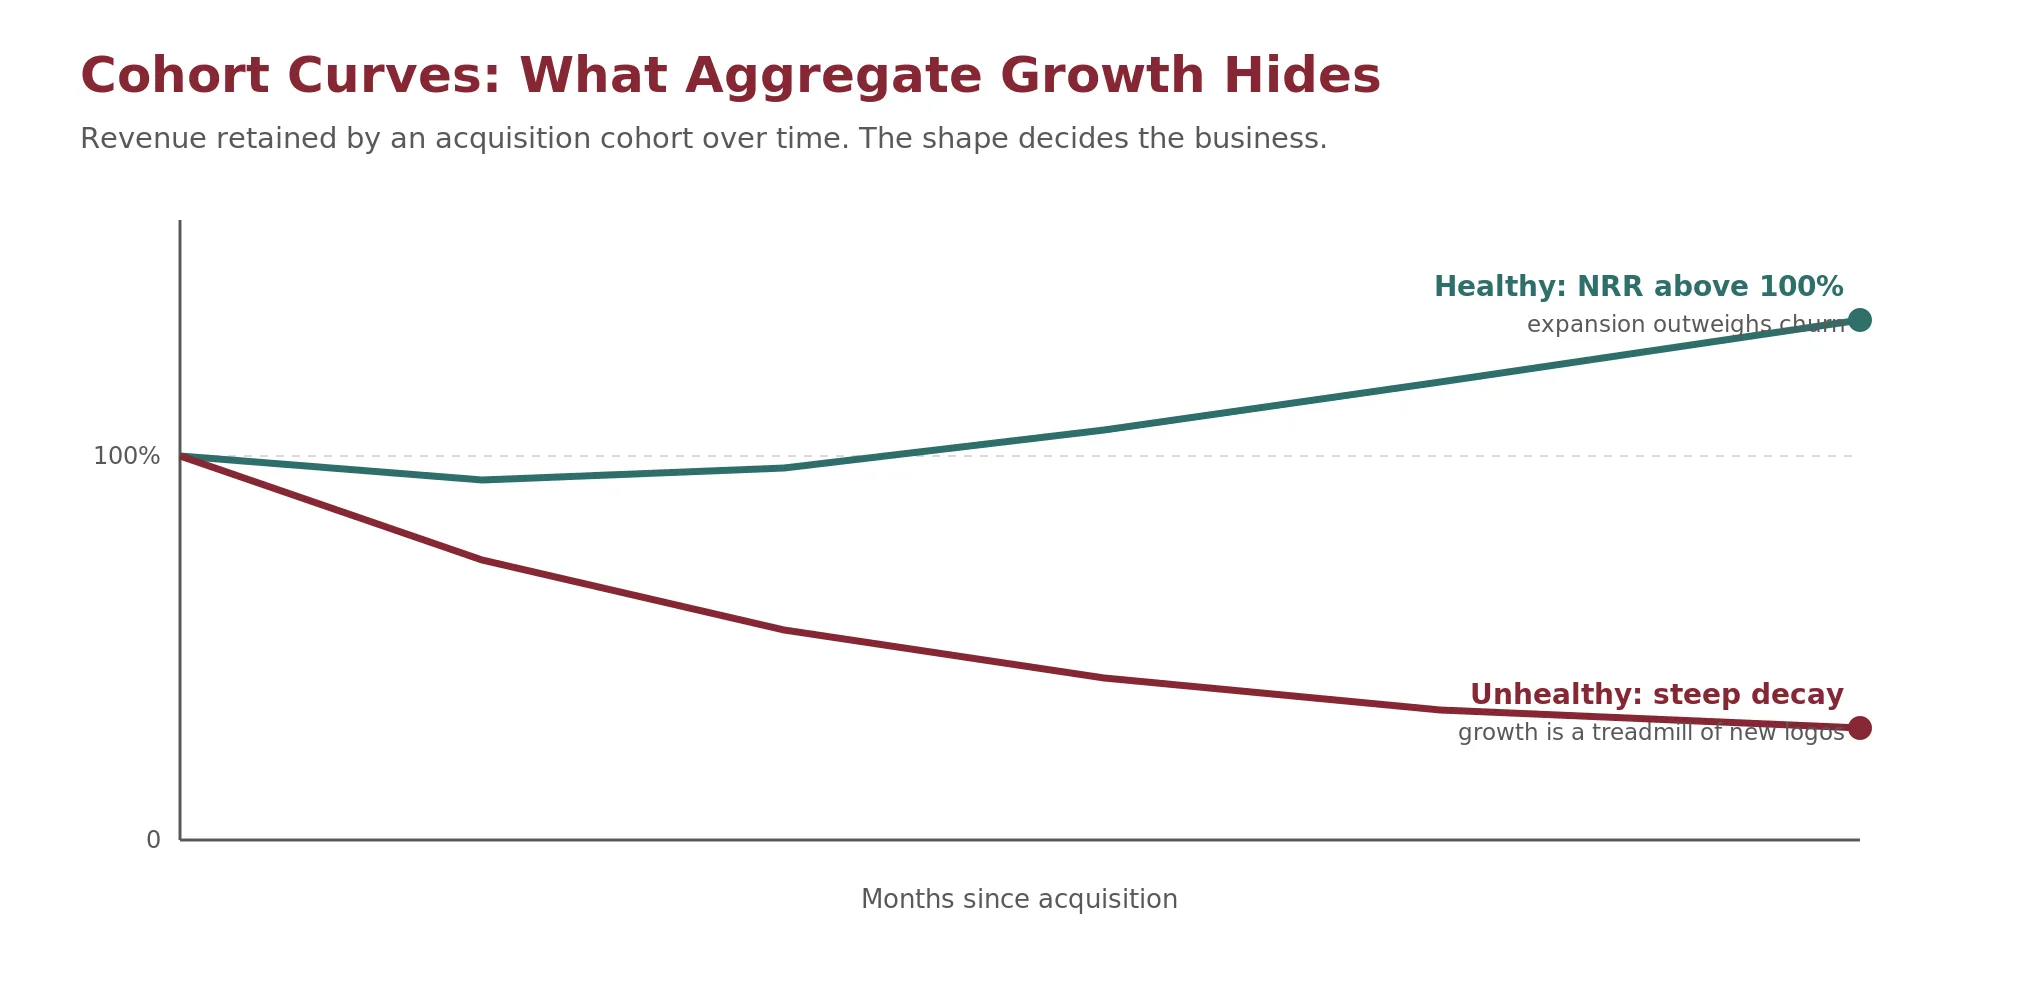
A healthy cohort curve flattens or expands, with net revenue retention above 100%, meaning customers stay and spend more. An unhealthy curve drops steeply, meaning customers churn quickly. For subscription and SaaS businesses, cohort analysis is one of the most revealing diagnostics available. Request cohort data during evaluation. If the company cannot produce it, that is itself a data-maturity red flag.
Check Your Understanding
Knowledge Check 11
Unit Economics & LTV/CAC
A startup grows revenue 30% year over year, but each customer cohort loses 40% of its revenue within 12 months. The most accurate read is:
Vertical, Horizontal, and Peer Analysis
Financial statement analysis relies on three complementary tools that each reveal a different dimension of performance. All three apply to startups, but each requires adaptation for the early-stage context.
Vertical Analysis (Proportion)
Vertical analysis expresses each line item as a percentage of a base, typically revenue. It reveals the proportional structure of the business: how much of each revenue dollar goes to cost of goods sold, operating expenses, and profit. For startups, it answers whether the model's unit economics are viable. Key ratios include profit margin (net income over revenue), gross margin (revenue minus cost of goods sold, over revenue), and operating margin (operating income over revenue).
Horizontal Analysis (Trend)
Horizontal analysis tracks how each line item changes over time, usually as period-over-period percentage change. For startups, it reveals growth trajectories and whether the business is moving toward or away from sustainability. The challenge is limited history: two quarters is better than one, but five years from a mature company produces more stable trend lines. Focus on the direction and rate of change, recognizing that early volatility is normal.
Peer Analysis (Benchmarking)
Peer analysis compares a startup's metrics against comparable companies. This is where return on assets, return on equity, and income margin become most useful, because they allow comparison across companies of different sizes. The aim is to see how much value comes through income versus direct margin, and which levers the company can pull to improve.
The challenge is finding true peers. A Series A SaaS company should not be benchmarked against Microsoft, yet industry data often conflates very different stages. Identify three to five companies at a similar stage and model, even if the comparison is imperfect, rather than benchmarking against averages dominated by mature incumbents.
Check Your Understanding
Knowledge Check 12
Financial Statements & Cash Flow
An analyst wants to see what share of each revenue dollar goes to cost of goods sold and operating expenses. Which tool answers this directly?
Driver-Based Forecasting Connects Assumptions to Outcomes
Much of the rest of the course builds financial forecasts for specific businesses. The method is driver-based forecasting: tying every line in the forecast to an identifiable operational driver rather than extrapolating historical trends.
The logic is direct. Instead of saying revenue grew 20% last year so it will grow 20% next year, a driver-based model says: we have 5 salespeople who each close $200,000 per quarter; if we hire 3 more with a 2-quarter ramp, here is what revenue looks like. Every assumption is explicit, testable, and adjustable. For each revenue line, identify the drivers: how many salespeople generate a sale, the cost per acquisition, and how to apportion cost of sales, rent, software, and other indirect costs.
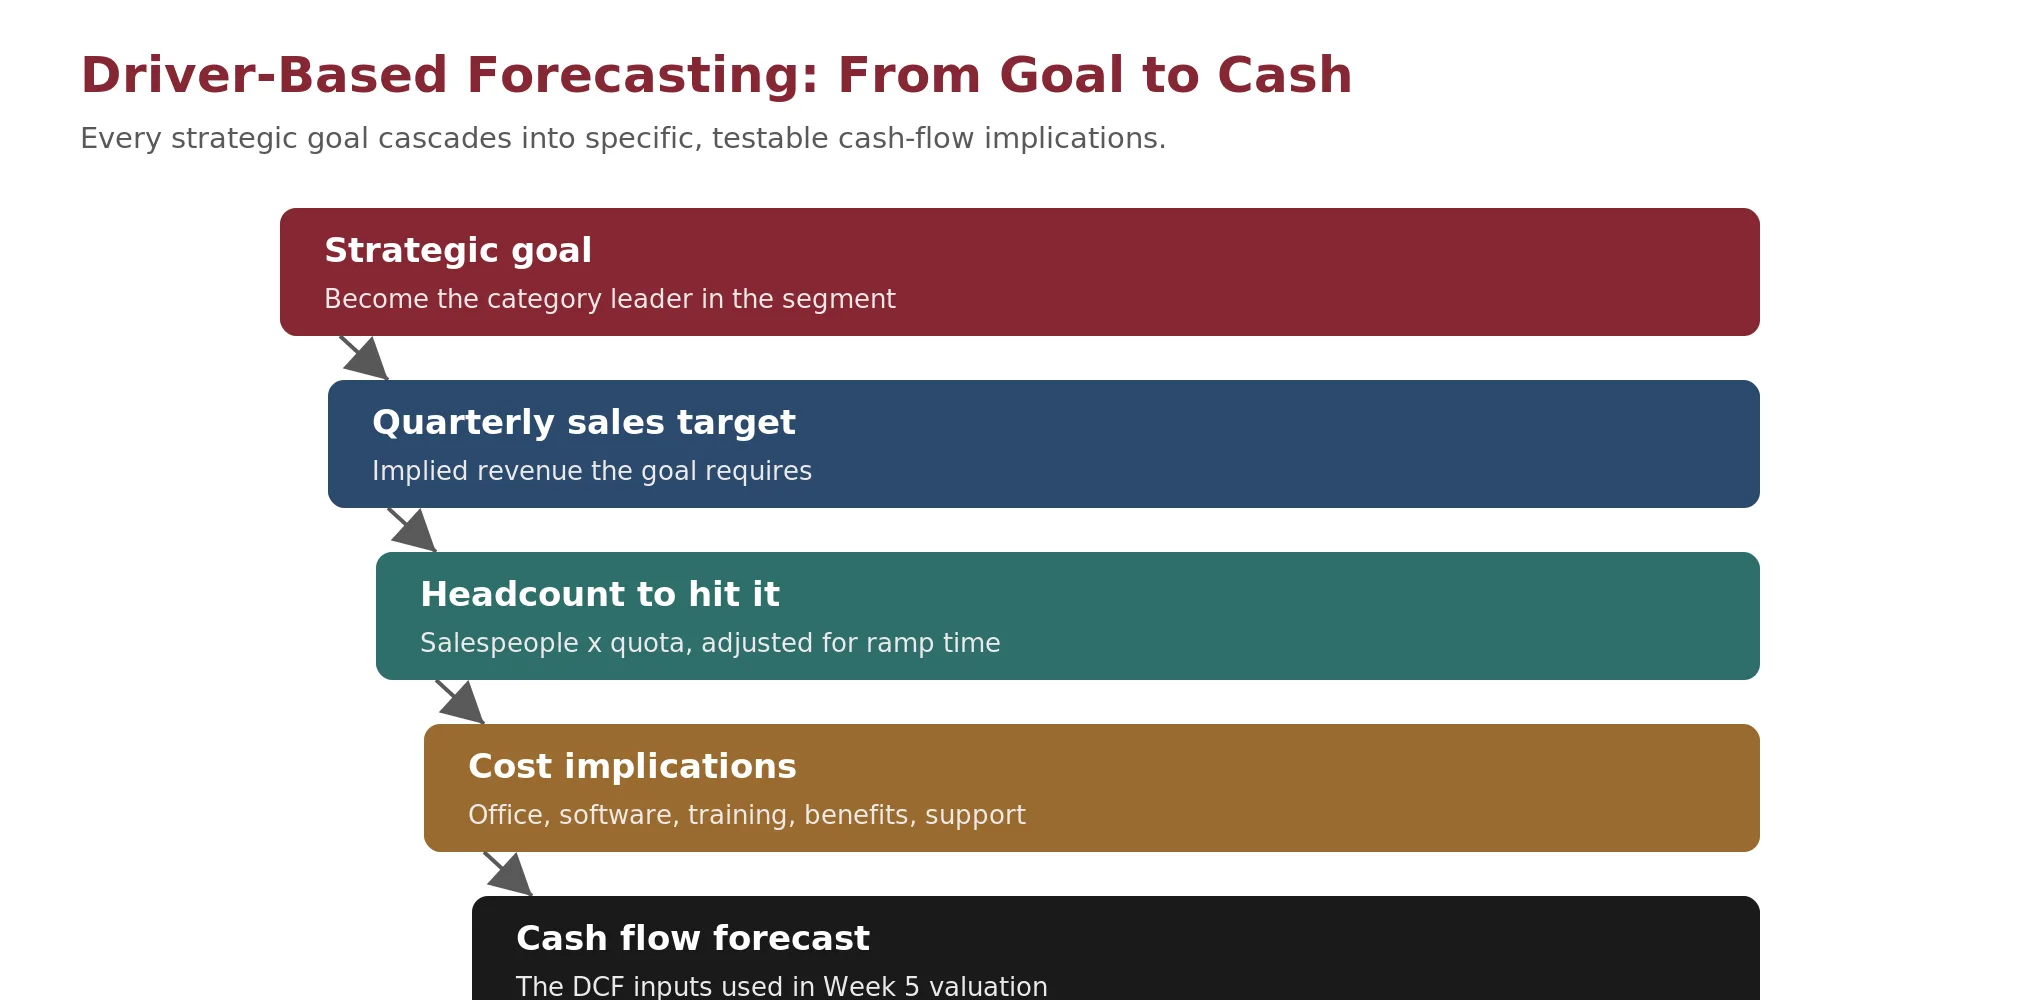
Best practice ties the forecast to the company's objectives. If the goal is to lead its segment, that translates into a quarterly sales target, which implies a headcount, which implies office space, software, training, and benefits. Every strategic goal cascades into specific cash-flow implications, and the forecast should make those connections explicit.
Best practices for driver-based models
- Keep all drivers and assumptions on a single dedicated tab.
- Include growth-rate assumptions that change over time (year 1 vs year 3 vs year 5).
- Compare forecast outputs against historical trends to validate reasonableness.
- When you change a single driver, the entire model should update automatically.
This feeds directly into the Week 5 valuation work. The cash flows forecast here become the inputs to the discounted cash flow model. The quality of the valuation is only as good as the forecast, and the forecast depends heavily on how well you understand the operational drivers.
AI Changes Who Builds the Model, Not Who Understands the Business
Tools such as Claude in Excel can now build sophisticated models given the right context, for roughly $100 per month, with substantial productivity gains. Understand what this changes and what it does not. The ability to build a basic model is becoming less differentiated. The advantage is knowing what the model should assume, where it is wrong, and how business reality should constrain the forecast. Modeling skill still matters for auditability, structure, review, and investor-grade presentation, but the competitive edge has shifted from construction to judgment.
The shift. AI can build the spreadsheet. On its own, it does not determine the right assumptions to put into it. Your value as an analyst comes from understanding the business well enough to supply those assumptions and to recognize when the model's outputs do not match reality.
Due Diligence Reveals What Founders Will Not
In financial due diligence and M&A, the same categories of risk surface repeatedly. A quality-of-earnings (QoE) analysis, the standard diligence deliverable, systematically evaluates whether reported earnings reflect sustainable operating performance. The areas below are where the most material findings tend to emerge.
| Focus area | What it reveals | Common red flags |
|---|---|---|
| Working capital | Whether the business can fund operations without new capital | Seasonal distortions, negative trends, stretching payables |
| Unrecorded liabilities | Obligations not on the statements | Verbal commitments, pending litigation, tax exposures |
| Accelerated cash receipts | Whether cash was pulled forward unsustainably | Annual prepayments booked as current, aggressive collection |
| Earnouts | Alignment of price with future performance | Unrealistic targets, ambiguous or manipulable metrics |
| Terminal value | Long-term value beyond the forecast | Optimistic growth, unsupported perpetuity rates |
| Revenue inflation | Whether revenue overstates economic activity | Gross reporting by agents, premature recognition, channel stuffing |
| Customer concentration | Revenue durability and scalability risk | Top 3 customers over 50% of revenue, no long-term contracts |
| Contract standardization | Operational maturity and scalability | Every deal custom, inconsistent terms, untracked obligations |
| Founder dependence | Key-person risk and hidden commitments | Verbal agreements, non-transferable relationships |
| Quality of earnings | Sustainable versus one-time earnings | One-time gains treated as recurring, aggressive add-backs |
The biggest indicators in acquisition agreements cluster around working capital, the valuation metrics from Part 4, and the forecasted future value of the business. Typically a reserve account (escrow or holdback) is established at closing. If items are misreported or expectations are missed during a post-closing true-up, funds can be clawed back from the seller. Earnouts tie additional payments to upside scenarios where the business exceeds aggressive targets.
The Data Room Checklist
When a startup enters a fundraising round or acquisition, it is expected to provide the following to investors or buyers:
- Financial statements (historical, interim, and any audited or reviewed statements)
- Bank statements (typically 12 to 24 months, all accounts)
- Customer contracts (top customers, standard terms, non-standard arrangements)
- Debt agreements (loans, lines of credit, convertible notes, SAFEs)
- Cap table (fully diluted, including option pool, warrants, and convertibles)
- Tax filings (federal and state, typically 3 years)
- Payroll records (headcount, compensation, contractor versus employee)
- AR and AP aging schedules (receivables and payables by age bucket)
- Board decks and minutes (governance, strategy, investor communications)
- KPI reports (operating metrics, dashboards, internal reporting)
- Revenue recognition memo (the policy, the ASC 606 assessment, and any deviations)
The completeness of the data room is itself a signal. A startup that produces these quickly demonstrates operational maturity. One that scrambles, provides partial information, or fails to produce basic records like AR and AP aging raises diligence risk before the analysis even begins.
Check Your Understanding
Knowledge Check 13
Revenue Recognition & Earnings Quality
In diligence, a startup's top three customers are 60% of revenue with no long-term contracts. In a quality-of-earnings review this most represents:
Capital Structure, Cap Tables, and Waterfalls
The final dimension of holistic startup analysis is the capital structure: who has invested, on what terms, and what rights accompany each layer of financing. Many founders give away equity to co-founders and take on debt with covenants that constrain future decisions. Each layer adds stakeholders with their own return requirements and contractual protections. A solo founder with employees operates in a fundamentally simpler system than three co-founders with two bank relationships, angel investors, and a venture firm, each with distinct rights.
The Debt-to-Equity Spectrum
Financing instruments sit on a spectrum from pure debt to pure equity, with hybrids in between. All are contracts governed by law, but there is wide flexibility in how they are structured. Some debt carries equity-like features (convertible notes, warrants), and some equity carries debt-like features (preferred with stated dividends). Where each instrument falls reveals who the real stakeholders are and what their incentives look like.
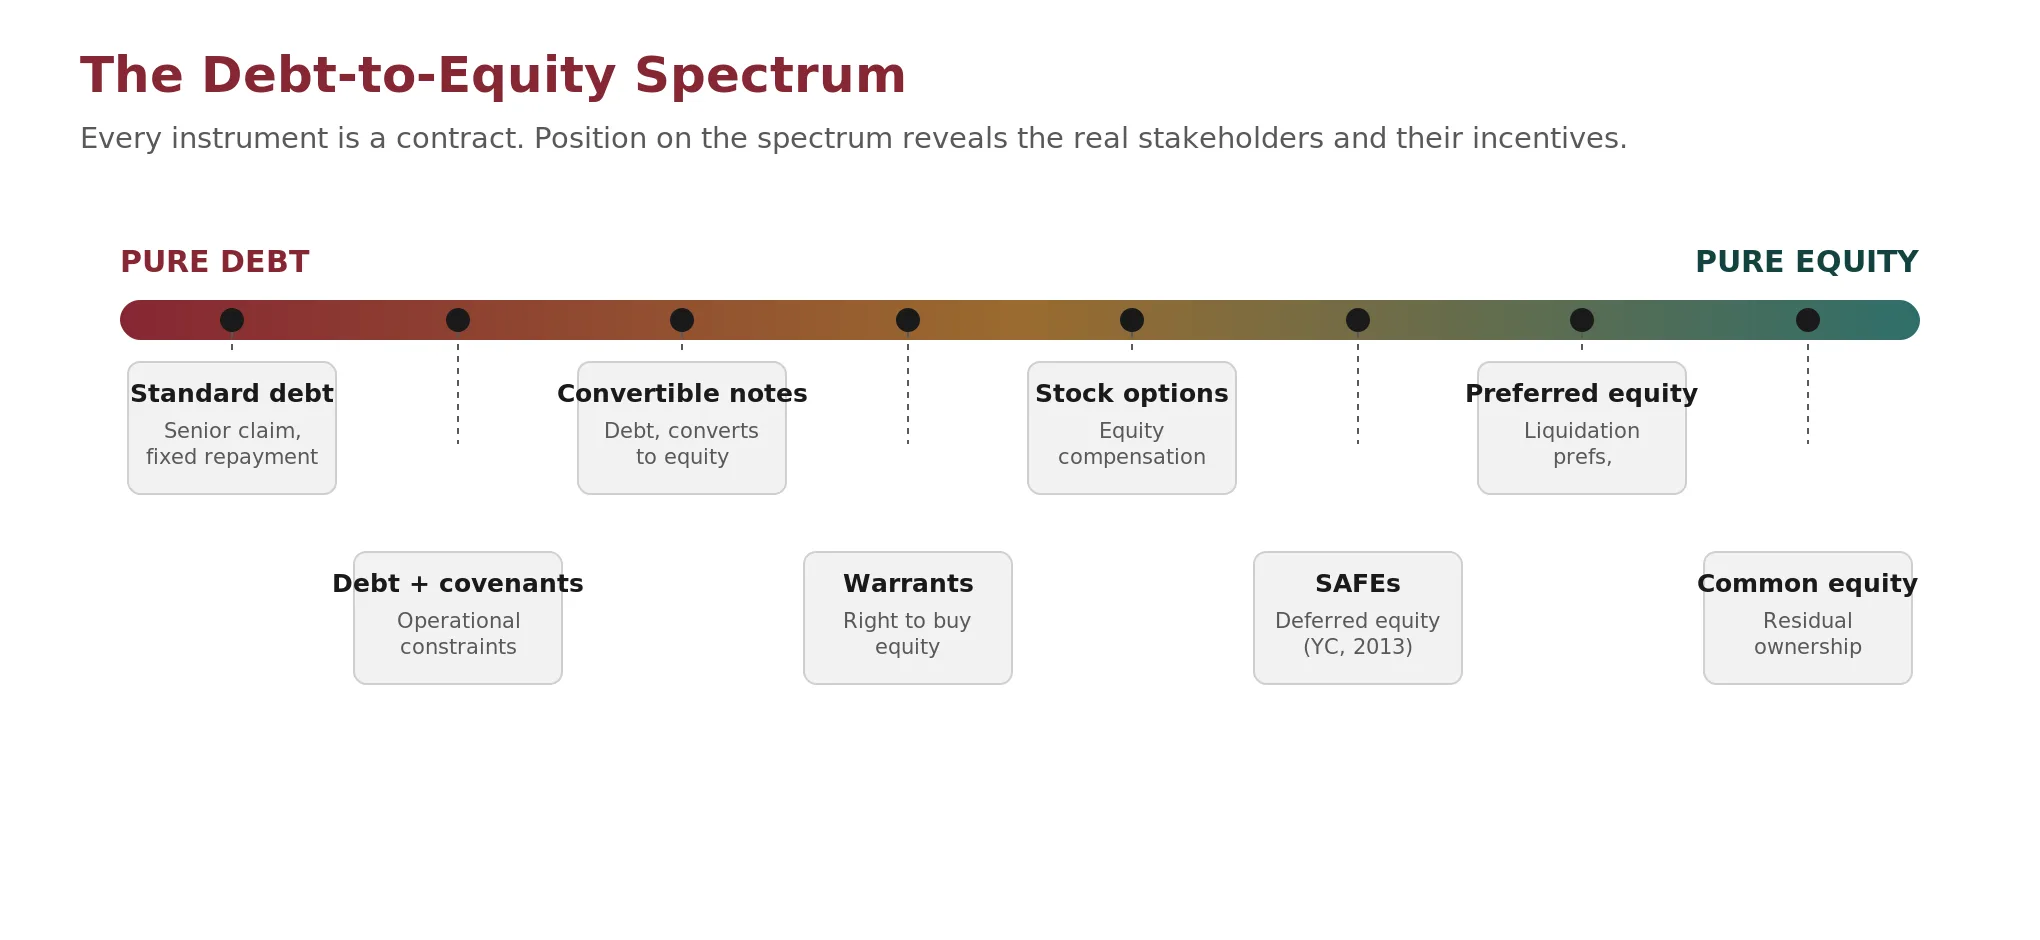
| Instrument | Position | Key characteristics |
|---|---|---|
| Standard debt / revolver | Pure debt | Fixed repayment, interest, senior claim in liquidation |
| Long-term debt with covenants | Debt with restrictions | Extended terms plus operational constraints (e.g., minimum working capital) |
| Convertible notes | Debt with equity upside | Converts to equity at a future round, usually with a discount or cap; accrues interest, has a maturity |
| Warrants | Equity-adjacent | Right to buy equity at a set price; often attached to debt |
| Stock options | Equity compensation | Right to buy shares at a strike price; used for employees and advisors |
| SAFEs | Equity-linked | Deferred equity (Y Combinator, 2013); converts at the next priced round; no interest or maturity; not debt |
| Preferred equity | Equity with protections | Liquidation preference, possible dividends, conversion, anti-dilution, governance rights |
| Common equity | Pure equity | Residual ownership; may have multiple classes with different votes |
Cap Tables and Liquidation Waterfalls Determine Who Gets Paid
The spectrum describes the instruments; the cap table and waterfall describe the outcomes. A cap table is the ledger of who owns what: every share class, option, warrant, SAFE, and note, on a fully diluted basis. The liquidation waterfall is the calculation of who receives what in a liquidity event, given the rights attached to each instrument.
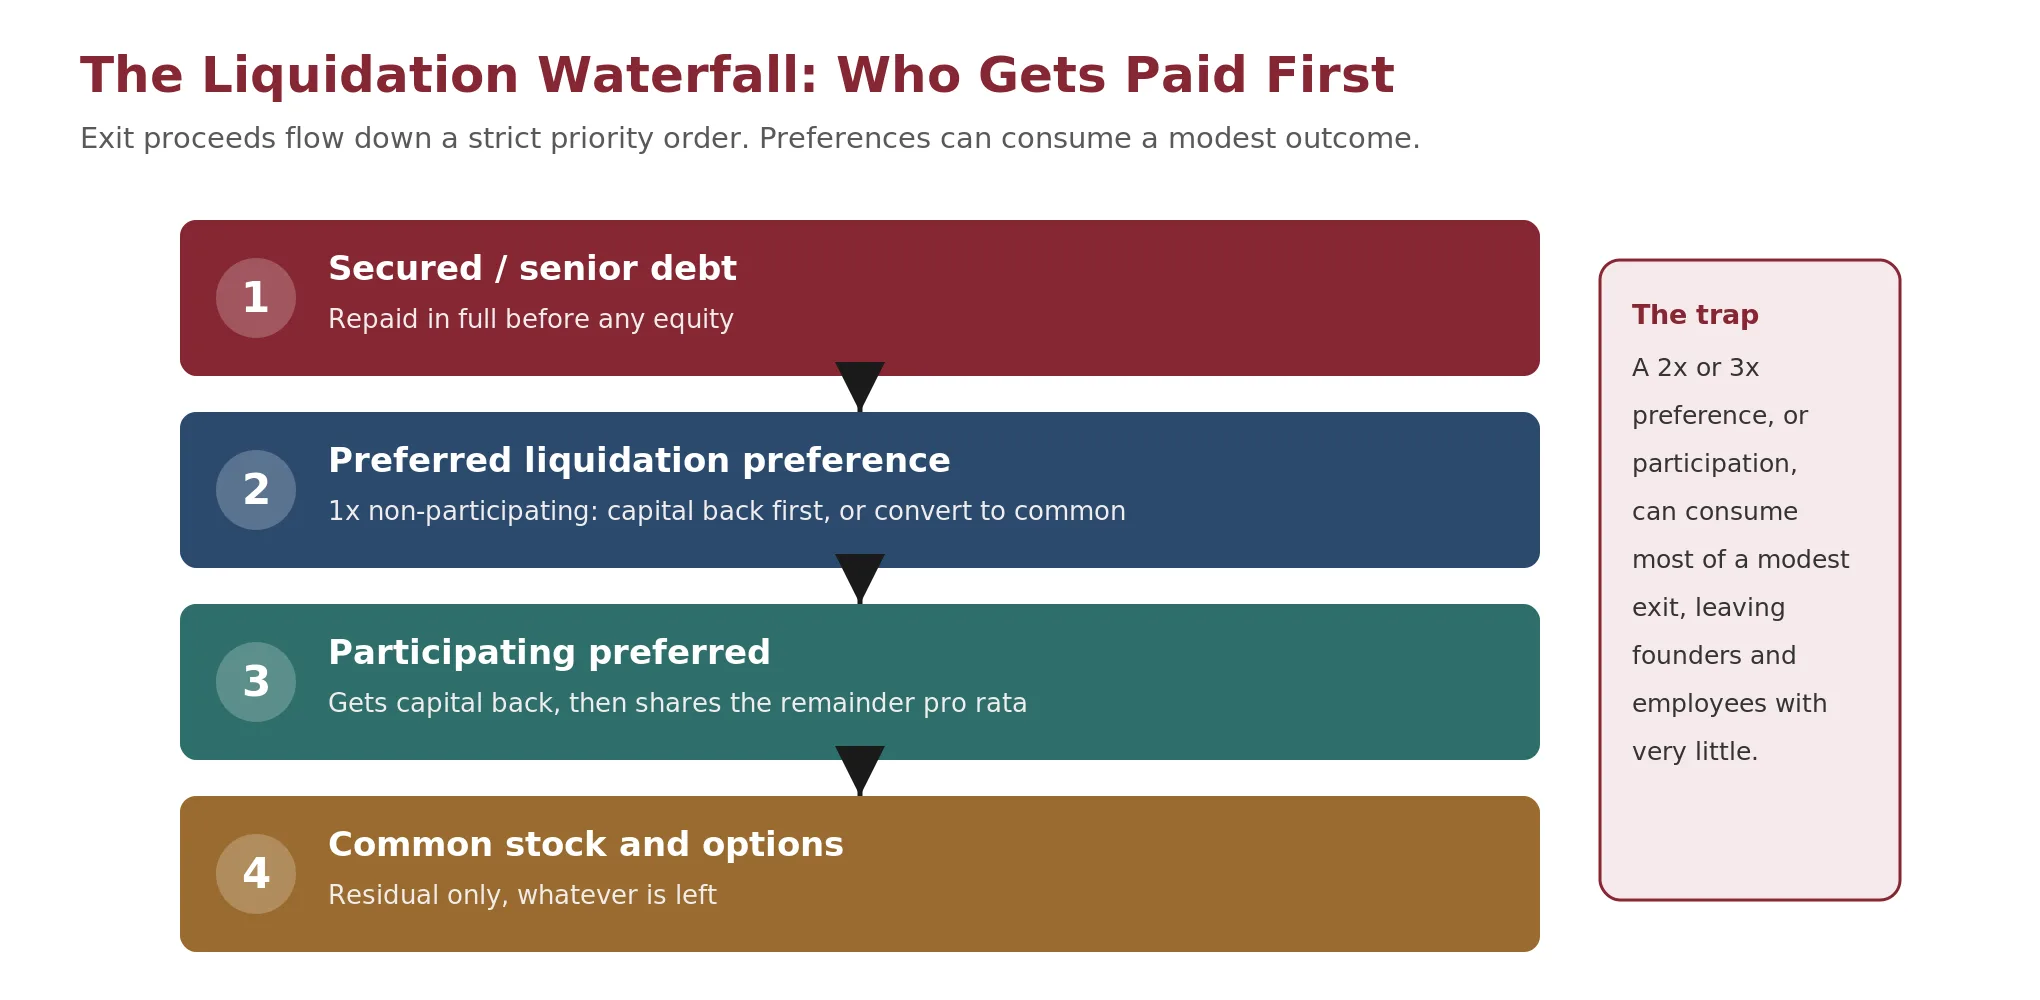
Liquidation preferences are the most impactful term for founders and common holders. A 1x non-participating preferred investor in a $5 million round gets $5 million back before anyone else, or converts to common if that is worth more. Participating preferred gets its money back and then shares the remainder pro rata with common. Multiple preferences (2x, 3x) can consume the majority of a modest exit, leaving founders and employees with little.
Worked example: one cap table, three outcomes
An investor puts $4 million into a 1x preferred and holds 40% of the company on an as-converted basis; common holds the other 60%. Watch how the structure and the exit value change who gets paid.
| Scenario | Preferred receives | Common receives |
|---|---|---|
| $8M exit, 1x non-participating | $4.0M (takes the preference) | $4.0M |
| $8M exit, 1x participating | $5.6M ($4.0M back, then 40% of $4.0M) | $2.4M |
| $20M exit, 1x non-participating | $8.0M (converts to 40% of $20M) | $12.0M |
At the $8 million exit, moving from non-participating to participating shifts $1.6 million from common to the investor. At the $20 million exit, the non-participating investor converts to common because 40% of the proceeds ($8 million) exceeds the $4 million preference. Options, SAFEs, and convertible notes all dilute founders further when they convert: a founder owning 60% before a Series A may hold 35% after the option pool, SAFE conversions, and new investor shares.
Adjust the investment, preference multiple, ownership, exit value, and participation to see how the split between preferred and common changes. The defaults reproduce the worked example above ($8M exit, 1x non-participating: preferred $4M, common $4M).
Check Your Understanding
Knowledge Check 14
Term Sheets & Liquidation Preferences
A startup exits for $8 million. An investor holds a 1x participating preferred on a $4 million investment. Versus a 1x non-participating investor, the participating investor generally receives:
Financial Reality Must Match the Founder Narrative
Once you have worked through data quality, revenue recognition, cash flow, unit economics, statement analysis, driver-based forecasting, diligence findings, and capital structure, you should be able to answer one question: does what the business purports to be doing match what the underlying financial information indicates?
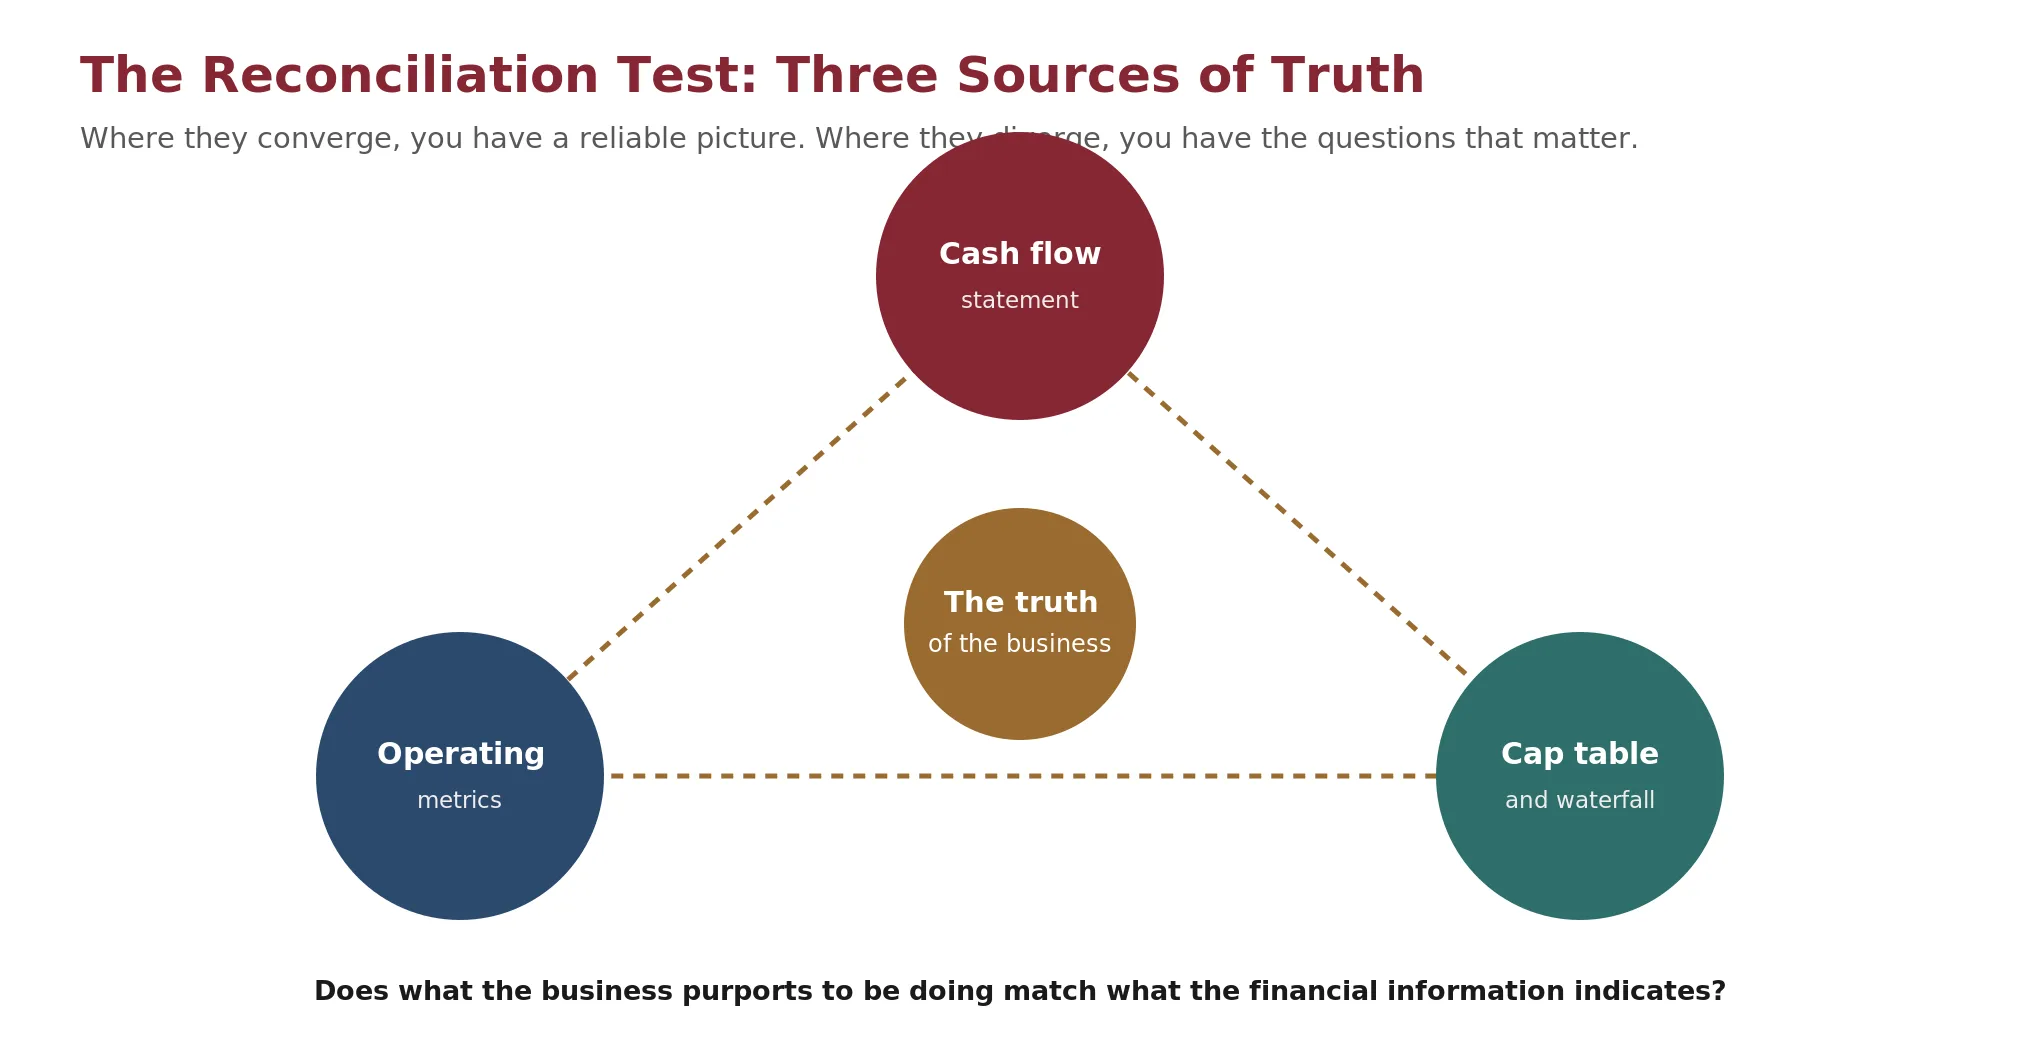
If the answer is no, return to the original claims and adjust them to match financial reality. Cash flow is often the best starting point for testing whether the founder narrative is economically real. It does not answer every question, but it usually reveals where the story deserves more scrutiny.
This is the capstone skill of financial statement analysis in the entrepreneurial context. The frameworks, indicators, and tools in this module are not academic exercises. They are the toolkit you will use to separate signal from noise, identify where the narrative diverges from reality, and make better investment, advisory, and operational decisions.
Does what the business purports to be doing match what the financial information indicates?
Limits of the Toolkit
This module is a diagnostic toolkit, not a verdict. It surfaces where the founder narrative and the financial numbers diverge; it does not, by itself, decide which is correct.
Its tools assume reliable inputs, which is precisely what early-stage data lacks. Each output is only as good as the underlying data and the adjustments the analyst makes to it.
The benchmarks and heuristics used here, including a PEG below 1.0, a roughly 3:1 LTV:CAC, and net revenue retention above 100%, are practitioner reference points that vary by sector, stage, and cycle, not universal thresholds.
Accounting determinations such as principal versus agent and the timing of revenue recognition are matters of professional judgment under the standards, not mechanical rules, and reasonable analysts can reach different conclusions.
The valuation mechanics introduced here, FCFF, FCFE, and terminal value, are applied in full in Weeks 4 and 5. This module builds the inputs and the analytical instinct, not the complete discounted cash flow model.