
Week 2CHAPTER 02
The Venture Economics Framework
How to assess the economic quality of a business opportunity, layer by layer. A practitioner framework for evaluating how ventures create, capture, and sustain value: problem-solution fit and the evidence ladder; revenue-model classification and operating leverage; pricing strategy and sensitivity; channel and go-to-market fit; unit economics (CAC, LTV, payback, churn, burn, runway); market sizing with TAM/SAM/SOM and competitive position; financial viability and default-alive analysis; and the Venture Viability Scorecard that synthesizes all seven layers into a recommendation, with four interactive calculators.
~195 min8 sections53 questions5 tools
Learning objectives (9)
Learning Objectives
By the end of this chapter you should be able to:
- 1Explain why entrepreneurial finance requires evaluating both the founder and the economic quality of the business opportunity.
- 2Assess problem-solution fit by identifying the customer problem, target customer, existing alternatives, willingness to pay, and evidence supporting demand.
- 3Classify a venture’s revenue model as product, services, intellectual property/licensing, marketplace/commission, advertising, financial intermediation/risk transfer, or hybrid, and explain how that model affects margins, scalability, and capital requirements.
- 4Evaluate pricing strategy by distinguishing between cost-plus, competition-based, and value-based pricing, and by analyzing how price metrics influence customer adoption and profitability.
- 5Determine whether a company’s go-to-market strategy fits its customer type, annual contract value, sales motion, and adoption friction.
- 6Analyze unit economics using metrics such as gross margin, contribution margin, CAC, LTV, LTV:CAC, CAC payback, churn, retention, burn rate, and runway.
- 7Estimate market opportunity using TAM, SAM, and SOM, and assess whether the company has a credible beachhead strategy and competitive position.
- 8Evaluate financial viability by connecting business model, unit economics, market size, capital needs, cash runway, and path to profitability.
- 9Apply the Venture Viability Scorecard to synthesize the seven analytical layers into a clear investment, lending, advisory, or founder recommendation.
Part One: How to Read a Business Opportunity. Section 1 of 8.
Part One · How to Read a Business Opportunity
How to Read a Business Opportunity
Using This Module
Estimated working time: 90 to 120 minutes to read, plus 45 to 60 minutes for the knowledge checks and practice bank.
This module is one part of the Entrepreneurial Finance sequence. It builds directly on the Founder Archetype Matrix, which assesses the entrepreneur, and it sets up the financial-modeling module that follows.
How to work through it
Read the seven layers in order, since each builds on the one before it. Pause at each Knowledge Check and answer before reading the explanation. The figures each carry a written text equivalent, so the module is fully usable without color or images.
Use the Venture Viability Scorecard as your working checklist when you apply the framework to a real business, and the practice bank to test recall and application before an assessment.
From Founder to Opportunity
In my advisory work, I have seen brilliant founders with terrible business models and mediocre founders with excellent ones. The founder matters, but the economics of the opportunity are non-negotiable. A strong founder entering a market with structurally broken unit economics will still fail. A weaker founder with a validated solution in a market with strong fundamentals can build something durable.
The Venture Economics Framework provides a structured approach to evaluating any business opportunity through seven analytical layers, followed by an integrating diagnostic scorecard. Each layer builds on the one before it, and together they answer the question that investors, lenders, and advisors need answered: does this business make economic sense?
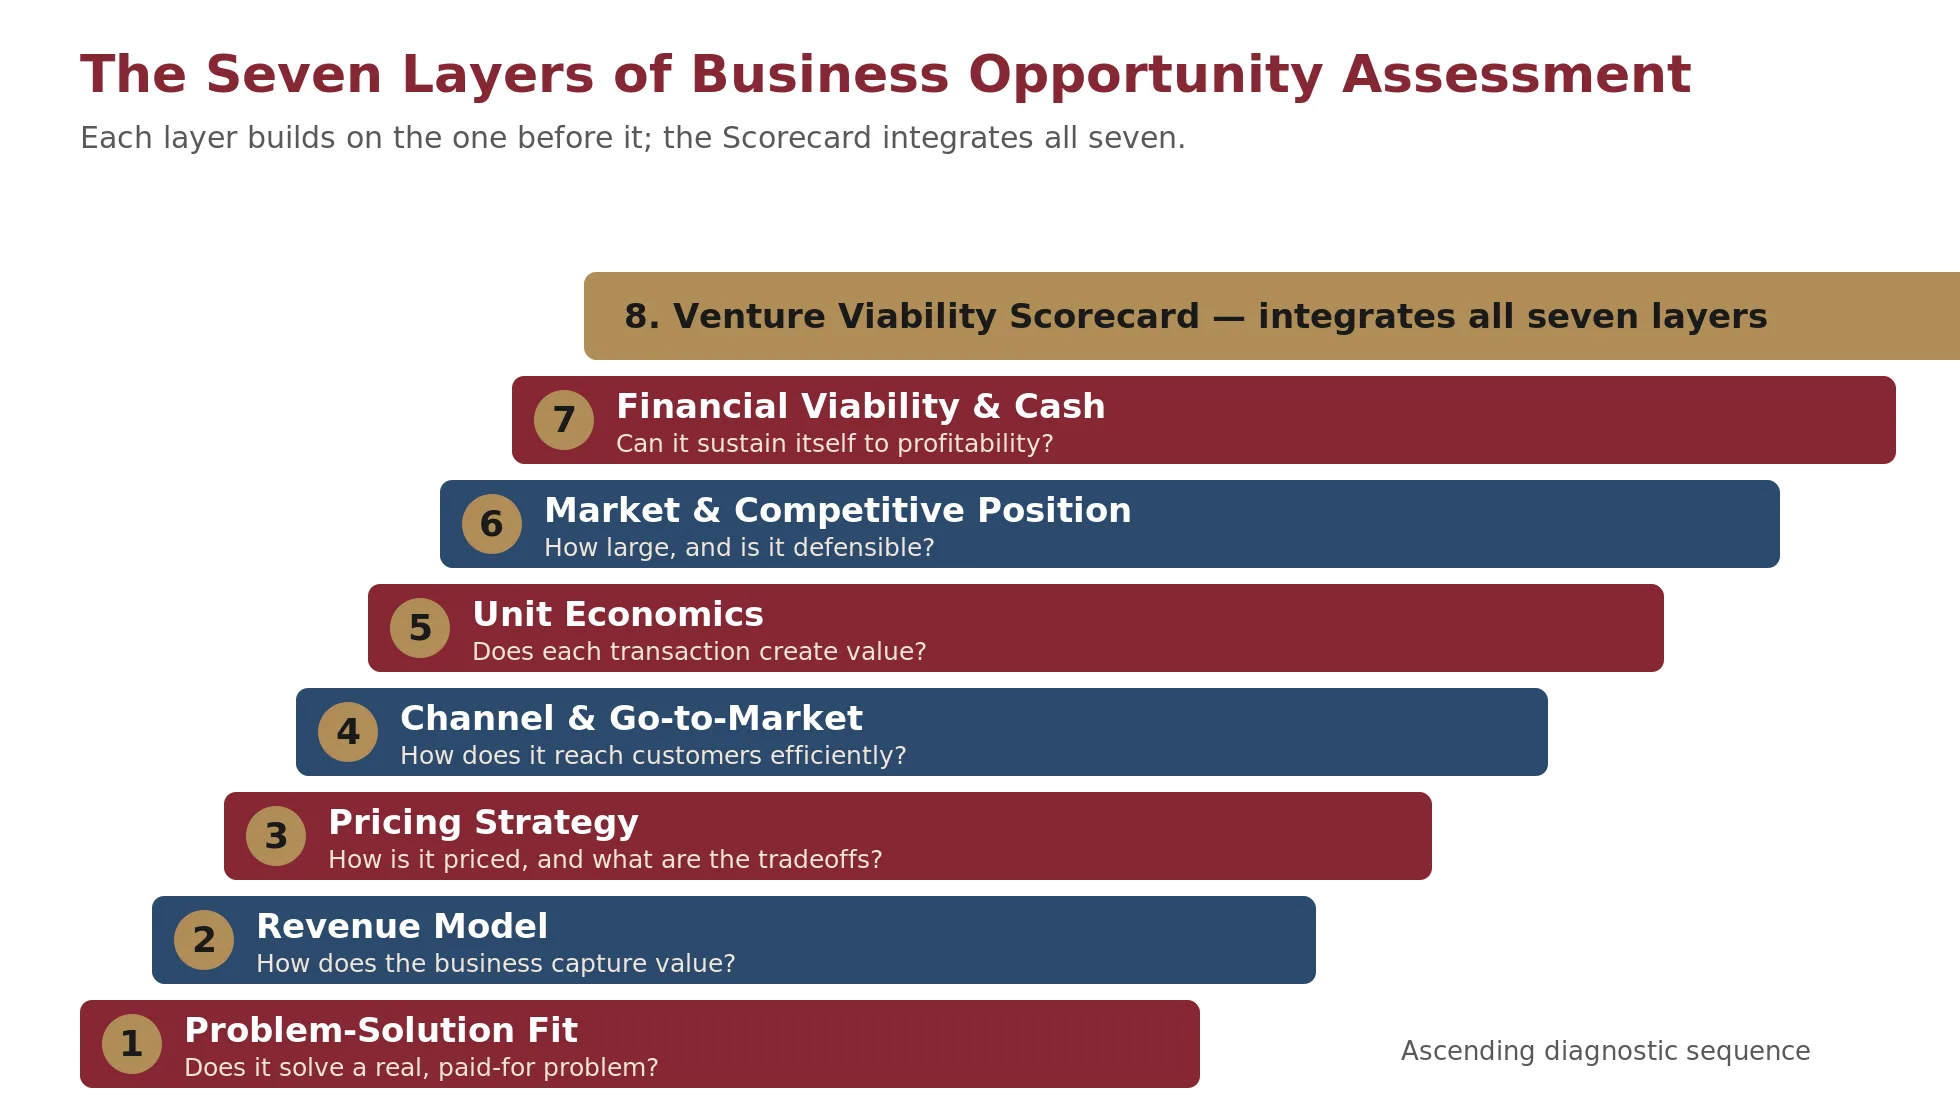
The seven layers and their central questions
| Layer | Central question |
|---|---|
| 1. Problem-Solution Fit | What problem does this solve, and will people pay for the solution? |
| 2. Revenue Model | How does the business capture value (Product, Services, IP, Marketplace, Advertising)? |
| 3. Pricing Strategy | How is the offering priced, and what are the tradeoffs? |
| 4. Channel & Go-to-Market | How does the business reach customers efficiently? |
| 5. Unit Economics | Does each transaction create economic value at the unit level? |
| 6. Market Sizing & Competitive Position | How large is the opportunity, and is it defensible? |
| 7. Financial Viability & Cash | Can the business sustain itself and reach profitability given available capital? |
| 8. Scorecard | Integrating diagnostic that synthesizes all seven layers into one assessment. |
Check Your Understanding
Knowledge Check 1
Founder Archetypes & Identity
A venture-evaluation approach scores a business opportunity through analytical layers (problem-solution fit, revenue model, pricing, unit economics, market size, and cash) separately from a founder assessment that diagnoses the entrepreneur. Why assess the opportunity separately from the founder?
Layer 1: Problem-Solution Fit
A business is a set of inputs and processes that combine to create something greater than the sum of their parts, specifically solving a problem that people are willing to pay for in a way that generates a profit while simultaneously adding value to customers. You are taking some combination of resources, labor and effort, and ingenuity and combining them into something more valuable for everyone else.
This definition sounds obvious, but a surprising number of startup failures trace back to a violation of its core logic: the founder built something that did not solve a problem people were willing to pay for. Clayton Christensen's Jobs to Be Done theory (2016) provides the sharpest lens here. Customers do not buy products or services. They hire them to do a job. The job is the unit of analysis, not the product. When a founder pitches a business, the first question is: what job does this solve, and for whom?
Eric Ries's Lean Startup methodology (2011) operationalizes this through the concept of validated learning. Rather than building a complete product and hoping customers want it, founders should build the minimum viable product (MVP) needed to test whether the problem-solution hypothesis is correct. The goal is to learn whether customers will pay for this solution before committing significant capital.
The Problem-Solution Diagnostic
When assessing any business idea, start with four questions:
- What specific problem does this solve? If the founder cannot articulate the problem in one sentence, the idea is not ready. A problem that requires a paragraph to explain is usually a solution looking for a problem.
- Who has this problem, and how badly? The intensity of the customer's pain determines willingness to pay. A mild inconvenience produces a "nice to have." A costly, recurring, urgent problem produces a "must have."
- How are people solving this problem today? Nearly every problem has an existing solution, even if that solution is doing nothing. The founder's offering needs to be meaningfully better than the status quo on a dimension customers care about.
- Will people pay enough to make this profitable? A real problem with a willing customer base is necessary but not sufficient. The economics of delivering the solution must leave room for profit after all costs are accounted for.
Check Your Understanding
Knowledge Check 2
Business & Revenue Models
A founder needs three paragraphs to explain the problem the product solves. What does this most likely signal about how ready the idea is?
From Problem-Solution Fit to Product-Market Fit
Problem-Solution Fit and Product-Market Fit are related but distinct milestones. Problem-Solution Fit asks: does a real problem exist, and is our proposed solution viable? Product-Market Fit, a concept coined by Andy Rachleff at Benchmark Capital and popularized by Marc Andreessen (2007), asks: have we built the right product for a specific market that actively pulls it from us?
The difference matters because many startups confirm that a problem exists but build the wrong product for the wrong segment. Rachleff's framework distinguishes between the value hypothesis (will customers use and pay for this?) and the growth hypothesis (can we scale acquisition efficiently?). Validate the value hypothesis first. A founder who jumps to growth before confirming product-market fit risks scaling a business that does not work.
In practice, I look for these signals of genuine product-market fit: organic referrals without paid marketing, customers who resist churn even when competitors undercut on price, usage patterns that deepen over time rather than declining after onboarding, and expansion revenue where existing customers voluntarily buy more. If these signals are absent, the founder has a hypothesis, not a business.
Check Your Understanding
Knowledge Check 3
Business & Revenue Models
What distinguishes Problem-Solution Fit from Product-Market Fit?
The Evidence Ladder
When a founder says "customers will pay for this," the next question is: how do you know? The answer matters enormously. I use an evidence ladder to assess the strength of their validation:
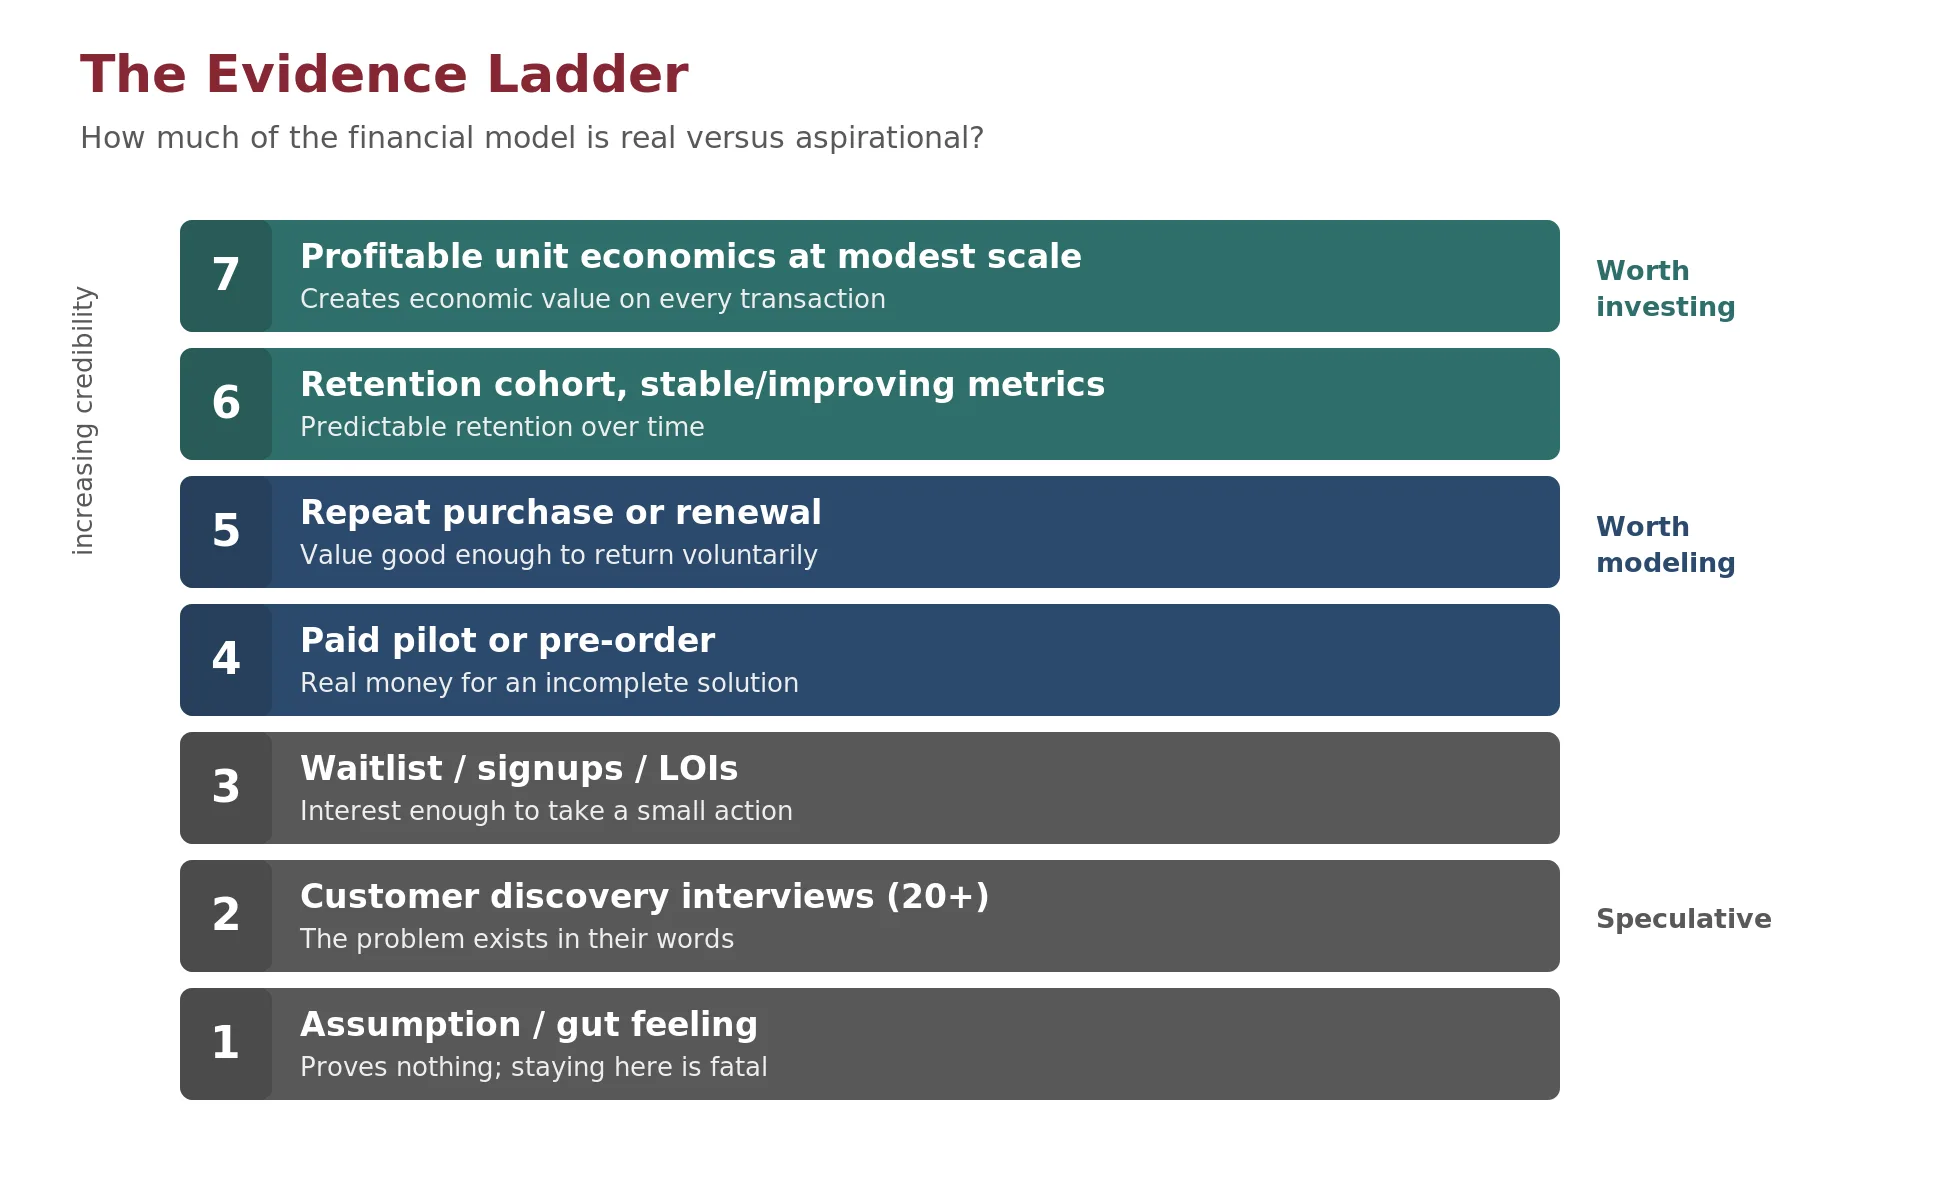
| Level | Evidence Type | What It Proves |
|---|---|---|
| 1 | Assumption / gut feeling | Nothing. Most startups start here, but staying here is fatal. |
| 2 | Customer discovery interviews (20+) | The problem exists and people describe it in their own words. |
| 3 | Waitlist, landing page signups, or LOIs | People are interested enough to take a small action. |
| 4 | Paid pilot or pre-order | Someone exchanged real money for an incomplete solution. This is the first credible signal. |
| 5 | Repeat purchase or renewal | The product delivered enough value that a customer came back voluntarily. |
| 6 | Retention cohort with stable or improving metrics | The business retains customers at a predictable rate over time. |
| 7 | Profitable unit economics at modest scale | The business creates economic value on every transaction, not just revenue. |
A founder at Level 1 is speculating. A founder at Level 4 has something worth modeling. A founder at Level 6 or 7 has something worth investing in. When evaluating any business opportunity, locating the founder on this ladder is one of the fastest ways to assess how much of the financial model is real versus aspirational.
From the Field: The AI Tool That Solved a Non-Problem
The problem was at Evidence Ladder Level 1. The founder had built the product based on his own experience as a former analyst and assumed the pain was universal. When we ran customer discovery interviews with 15 commercial real estate firms, a different picture emerged. The largest shops (which processed enough deals to justify the tool) already had internal systems and trained analysts who could do this work reliably. The mid-market shops (which felt the pain most acutely) did not process enough deals per month to justify the subscription cost. The firms that were genuinely interested were small operators processing 2-3 deals per month, but at that volume, the math did not work: the time savings per deal were real, but the total monthly value was maybe $200-300, and the founder needed to charge $1,500/month to make the unit economics work.
The founder eventually pivoted to selling the technology as an API to larger real estate technology platforms (a licensing model rather than a direct SaaS model), which was a viable path. But the original business plan, which projected $5 million in ARR within two years based on direct sales to underwriting teams, was built on a Level 1 assumption about who would pay and how much. The Evidence Ladder would have caught this before six months of product development.
Check Your Understanding
Knowledge Check 4
Business & Revenue Models
A founder has 30 discovery interviews and a 400-person waitlist, but no one has paid. Where does this sit on the Evidence Ladder?
Layer 2
Revenue Model Classification
Once you have established that a real problem exists and customers will pay to solve it, the next question is: how does the business capture that value? One of the cleanest ways to assess this is through financial statement analysis; specifically, considering benchmark companies and analysing their revenue, cost, and expense drivers. Revenue lines tell you exactly how a business monetizes, and cost structures tell you what it takes to deliver on that revenue.
The Six Primary Revenue Models
If you study enough financial statements across industries, a clear pattern emerges: most businesses generate revenue in one of six primary ways. Understanding which model a business uses is essential because each model has different margin structures, scaling dynamics, capital requirements, and go-to-market strategies.
| Revenue Model | How It Works | Example Companies |
|---|---|---|
| 1. Product | Creating physical products and selling them to solve customer problems | Nike, Apple, Procter & Gamble, Tesla |
| 2. Services | Performing labor or managing teams to solve problems; includes professional services, retainers, percentage-based fees | McKinsey, Deloitte, law firms, asset managers |
| 3. Intellectual Property / Licensing | Developing unique IP (software, content, patents, data) and licensing access; includes SaaS, on-premise, royalties, data licensing | Microsoft, Pfizer, Disney, Salesforce, Oracle |
| 4. Marketplace / Commission | Building platforms that connect buyers and sellers and charging a fee to facilitate transactions | Uber, Airbnb, Amazon Marketplace, Upwork |
| 5. Advertising | Building audiences or platforms and selling access to those audiences through ad placements, sponsorships, and bidding systems | Google (Alphabet), Meta, ByteDance, TV networks |
| 6. Financial Intermediation / Risk Transfer | Earning revenue by moving, pricing, lending, investing, protecting, or transferring capital and risk; includes interest spreads, premiums, AUM fees, transaction fees, interchange, and underwriting income | JPMorgan, Bank of America, BlackRock, Visa, Mastercard, AIG, Chubb, Coinbase, Charles Schwab |
The Revenue Model Diagnostic
When a founder describes their business, I use a simple diagnostic sequence to classify the revenue model:
- Is the primary value creation from labor or expertise? If yes, this is a Services business. The key question becomes utilization and billing rate.
- Is it from a physical product sold to the customer? If yes, this is a Product business. The key question becomes COGS and pricing power.
- Is it from intellectual property the customer licenses or subscribes to? If yes, this is an IP/Licensing business. The key question becomes R&D investment and marginal cost of distribution.
- Is it from connecting buyers and sellers and taking a fee? If yes, this is a Marketplace business. The key question becomes take rate and network effects.
- Is it from monetizing an audience through advertising? If yes, this is an Advertising business. The key question becomes audience scale and engagement.
If the answer is unclear, ask: where does most of the revenue show up on the income statement, and what is the largest cost required to generate it? That usually resolves the classification.
Hybrid Models and Revenue Stacking
Many businesses combine multiple revenue models. A technology company might have SaaS licensing revenue, professional services for implementation and training, and a marketplace connecting third-party developers with customers. Amazon is the canonical example: product sales, marketplace commissions, advertising, and cloud infrastructure (AWS) licensing all operate under one business.
When assessing a business model, you want to understand the primary way the business intends to generate revenue, because that primary model dictates the cost structure, go-to-market strategy, capital requirements, and margin profile. A SaaS business, a consumption-based revenue business, and a freemium-with-advertising model generally require fundamentally different operational strategies even when they serve the same customer. Osterwalder and Pigneur's Business Model Canvas provides a useful complementary tool for mapping how the revenue model connects to customer segments, value propositions, channels, and cost structure.
Check Your Understanding
Knowledge Check 5
Business & Revenue Models
A company reports revenue equal to gross bookings times a take rate, with COGS dominated by payment processing and insurance. Which revenue model is this?
Reading the Financial Statements: How Revenue Models Show Up in Disclosure
One of the most practical skills in entrepreneurial finance is learning to read a public company's financial statements and immediately identify its revenue model, margin structure, and key economic drivers. Every public company's 10-K or annual report breaks down revenue by segment and type, and the cost structure tells you what it takes to deliver.
Take Alphabet's 2024 10-K (fiscal year 2023) as an example. Revenue breaks into three clear segments: Google Services (Search advertising, YouTube advertising, subscriptions, devices), Google Cloud (enterprise infrastructure and platform licensing), and Other Bets (experimental ventures). Advertising alone accounts for roughly 77% of total revenue. When you see that, you immediately know: this is an advertising business. Alphabet remains primarily advertising-driven, though Google Cloud has emerged as a significant second economic engine with different margin dynamics, infrastructure costs, and an enterprise go-to-market motion distinct from the self-serve advertising business.
Compare that to Nike. Revenue is reported by product category (footwear, apparel, equipment) and by geography. Cost of sales is the dominant expense, driven by materials and contract manufacturing. Then selling, creating, and administrative expenses, which include the massive marketing and endorsement budget. R&D (which Nike calls “product creation”) is embedded in SG&A rather than broken out separately. The entire financial story is different: high COGS, brand-driven pricing power, and marketing expense as the primary growth lever.
Revenue Model Deep Dives with Case Studies
Product Business: Nike
Nike is the archetype of a product business done right. The company designs and markets athletic footwear and apparel but outsources nearly all manufacturing to contract factories, primarily in Vietnam, Indonesia, and China. This asset-light production model allows Nike to focus capital on what differentiates it: brand, design, and distribution.
Nike's financial signature reflects this strategy. Gross margins consistently hover around 44-46%, which is high for a product business, because the brand commands premium pricing far above manufacturing cost. The key P&L items are cost of goods sold (materials and contract manufacturing), selling and administrative expenses (marketing, athlete endorsements, and retail operations), and demand creation expense (the ~$4 billion annual investment in advertising and sponsorships that sustains the brand premium).
For students assessing a product business, Nike illustrates three principles: (1) brand can create margin even in commodity-adjacent categories; (2) outsourcing manufacturing reduces capital intensity but introduces supply chain risk; and (3) the primary financial lever is the spread between brand-driven pricing power and production cost.
Advertising Business: Alphabet (Google)
Google's mission is to organize the world's information and make it universally accessible and useful. The business model is advertising: Google builds products that attract massive user bases (Search, YouTube, Gmail, Maps, Android) and monetizes that attention through a sophisticated real-time bidding system that matches advertisers to users based on intent and behavior.
The financial signature is distinctive. Advertising accounts for roughly 77% of Alphabet's total revenue. The cost structure centers on traffic acquisition costs (payments to partners like Apple for default search placement), data center infrastructure, and R&D. Gross margins exceed 55%, and operating margins are approximately 27%. The key insight for students: most consumer-facing products Google builds feed the advertising engine. Search captures intent. YouTube captures attention. Gmail and Android capture identity and context. The advertising model requires building the largest possible relevant audience. Google Cloud, by contrast, operates as a genuinely separate business with its own enterprise sales motion, capital-intensive infrastructure, and a margin profile that looks more like an IP/licensing business than an advertising one.
Marketplace Business: Uber
Uber connects riders with drivers and takes a percentage of each transaction. The marketplace model's core dynamic is the network effect: more drivers reduce wait times, which attracts more riders, which attracts more drivers. The take rate (Uber's commission as a percentage of gross bookings) is the primary revenue lever.
Uber's financials illustrate marketplace economics clearly. Revenue is reported as net revenue (the take rate portion), not gross bookings. Cost of revenue includes insurance, payment processing, and driver incentives. The path to profitability for marketplace businesses typically requires achieving sufficient density in a given market to reduce subsidies (driver incentives) while maintaining take rates. Uber's journey from massive losses to operating profitability demonstrates the classic marketplace challenge: substantial investment is typically needed to build both sides of the market before the economics become self-sustaining.
Intellectual Property / Licensing Business: Microsoft
Microsoft's dominance in operating systems (Windows) and productivity software (Office/Microsoft 365) demonstrates the power of the IP licensing model. Once the software is built, the marginal cost of each additional license or subscription approaches zero. This produces gross margins near 70% across the company (fiscal 2024), and significantly higher in the pure software segments.
Microsoft's evolution from perpetual licenses to subscription-based SaaS (Microsoft 365, Azure) illustrates a critical strategic shift within the IP model. Perpetual licenses create lumpy, one-time revenue. Subscriptions create predictable, recurring revenue with higher lifetime value per customer. For students assessing IP businesses, the key financial metrics are R&D expense as a percentage of revenue (the investment required to maintain the IP moat), gross margin (the spread between licensing revenue and delivery cost), and net revenue retention (whether existing customers spend more over time, which we will define in Layer 5).
Services Business: Deloitte and the Professional Services Model
Deloitte, the largest professional services firm by revenue (approximately $67 billion in fiscal 2024), illustrates the economics and constraints of the services model. Revenue comes from four major practice areas: Audit & Assurance, Consulting, Tax & Legal, and Financial Advisory. Each practice monetizes expertise differently: audit uses fixed-fee engagements tied to client complexity, consulting uses project-based and time-and-materials billing, tax uses a mix of compliance retainers and advisory fees, and financial advisory uses success-based fees for transactions.
The financial signature of a services business is distinctive. Traditional product COGS is minimal because there is no physical product to manufacture. Instead, direct labor (salaries, benefits, and subcontractor costs for professionals delivering engagements) functions as cost of services or cost of revenue, which is the primary expense line in most services firm reporting. The dominant cost is people: salaries, benefits, training, and partner compensation consume 55-65% of revenue at most professional services firms. Gross margins of 50-70% are typical, but operating margins are thinner (15-25%) because selling, general, and administrative expenses are high. The key financial lever is utilization: the percentage of each professional's available hours that are billed to clients. A consulting practice running at 65% utilization versus 75% utilization can see operating margins swing by 10 or more percentage points, because the fixed cost of each consultant's salary does not change with utilization.
The structural constraint of services is that revenue tends to scale roughly linearly with headcount. A firm like Deloitte generally cannot serve twice as many clients without roughly twice as many professionals. This is why services businesses trade at lower revenue multiples (typically 1-3x revenue) compared to SaaS businesses (5-15x revenue): the buyer is acquiring a workforce, not a scalable asset. For founders building services businesses, the critical strategic question is whether any part of the service delivery can be systematized, productized, or technology-enabled to break the linear relationship between headcount and revenue. Many of the most successful services-to-product transitions in recent decades (Bloomberg, Thomson Reuters, Palantir) started as services businesses that identified a repeatable workflow and built software around it.
Asset management and wealth advisory firms represent a specific and important variant of the services model: percentage-based fee revenue. A wealth advisor charging 1% of assets under management on a $500 million book of business generates $5 million in annual revenue that recurs as long as clients stay and markets do not collapse. This creates a quasi-subscription revenue model with high gross margins (70-85%) and strong retention characteristics. The financial signature looks more like a SaaS business than a traditional services firm, which is why asset management firms trade at higher multiples (8-15x earnings) than other professional services. For students assessing any services startup, the question is: which flavor of services economics does this business have, and is there a path toward recurring, percentage-based, or productized revenue that improves the scaling dynamics?
Operating Leverage: Why Revenue Models Scale Differently
Operating leverage is the degree to which a business's cost structure is dominated by fixed costs rather than variable costs. It explains why a SaaS company can double revenue without doubling headcount, while a consulting firm cannot.
In a high operating leverage business (software, IP licensing, advertising platforms), most costs are fixed: R&D to build the product, infrastructure to host it. Each additional dollar of revenue drops almost entirely to the bottom line after the fixed cost base is covered. This is why software companies can have 30-40% operating margins at scale while burning cash in the early years when revenue has not yet covered the fixed investment.
In a low operating leverage business (services, staffing, physical products with high COGS), costs scale roughly in proportion to revenue. Each new consulting engagement requires new labor. Each additional physical product requires materials and manufacturing. Profit margins tend to be more stable but also more constrained. Growth does not dramatically improve profitability.
For founders, the operating leverage question is: as I grow revenue by 10x, do my costs grow by 2x (high leverage, strong) or by 8x (low leverage, constrained)? This directly impacts valuation, because investors pay higher multiples for businesses with high operating leverage, all else being equal. It also impacts capital requirements: high-leverage businesses need more upfront capital but less incremental capital per unit of growth.
Check Your Understanding
Knowledge Check 6
Business & Revenue Models
Why can a SaaS company double revenue without doubling headcount while a consulting firm cannot?
Three Pricing Approaches
Pricing is where strategy meets economics. There are fundamentally three approaches to pricing: cost-based, competition-based, and value-based. Most pricing scholars and practitioners consider value-based pricing superior, but each has its place depending on the business model and competitive context.
| Approach | How It Works | When to Use / Risks |
|---|---|---|
| Cost-Plus | Calculate total cost of delivering the product or service, then add a target margin. Price = Cost + Markup. | Works for commodity products with transparent costs. Risk: ignores customer willingness to pay. You may leave significant value on the table or price yourself out of the market. |
| Competition-Based | Set prices relative to competitors. Match, undercut, or premium-price based on positioning. | Works in mature markets with comparable products. Risk: triggers price wars and erodes industry margins. Does not reward differentiation. |
| Value-Based | Price based on the economic value the product or service creates for the customer. Price = Customer's Perceived Value x Capture Rate. | Superior for differentiated offerings. Requires deep understanding of customer economics. Risk: harder to implement; requires strong value communication. |
Check Your Understanding
Knowledge Check 7
Business & Revenue Models
A founder prices by adding a target margin to fully loaded cost. Which approach is this, and what is its central risk?
Price Metric Design and Tier Positioning
Price Metric Design
In entrepreneurial finance, the question is not only "what price?" It is also "priced per what?" The price metric, the unit of measurement attached to the price, is one of the most consequential design decisions a founder makes. Many ventures fail not because the product has no value, but because the pricing metric does not align with how customers experience value creation.
The ideal price metric scales with the value the customer receives. If a tool helps a sales team close more deals, pricing per deal closed (or per user per month) aligns the price with the outcome. If a platform processes transactions, pricing per transaction captures a share of the value at the moment it is created. Misaligned price metrics create friction: the customer pays when they are not receiving value, or the vendor captures nothing when the customer benefits most.
Common price metrics include:
- Per seat / per user: Standard for SaaS. Scales with team adoption. Risk: discourages broad adoption within organizations.
- Per transaction / per event: Common in payments, marketplaces, and API businesses. Aligns revenue with usage but creates revenue volatility.
- Per usage unit (compute, storage, API calls): Consumption-based pricing. Grows with customer success but is difficult to forecast.
- Percentage of GMV or savings: Directly ties revenue to customer outcomes. Powerful alignment but requires transparent measurement.
- Flat subscription: Predictable for both sides. Risk: customers who outgrow the tier feel overcharged; light users feel they overpay.
- Tiered subscription (Good/Better/Best): Captures different willingness to pay across segments. Most SaaS companies land here.
- Freemium to paid: Free tier for acquisition, paid tier for power users. Works when the free tier is genuinely useful and the upgrade trigger is natural.
- Enterprise license plus usage overage: Committed base revenue with upside from heavy usage. Common in infrastructure and data businesses.
High-Tier vs. Low-Tier Pricing
One of the most consequential strategic decisions a founder makes is where to position on the price spectrum. This choice cascades through every other business decision: cost structure, target customer, sales motion, support model, and margin profile.
| Dimension | High-Tier (Premium) | Low-Tier (Volume) |
|---|---|---|
| Margin per unit | High. Each sale contributes significantly to fixed cost coverage and profit. | Low. Profitability depends on volume. Small cost increases can eliminate margins. |
| Customer acquisition | Harder and slower. Longer sales cycles, more relationship-building, higher CAC. | Easier per customer but requires large volumes to achieve profitability. |
| Customer behavior | Fewer but more committed customers. Lower churn, higher engagement, better feedback. | More customers with lower switching costs. Higher churn, more support tickets, price sensitivity. |
| Cost management | Less critical at the unit level. Premium pricing provides buffer for operational inefficiency. | Critical. Every dollar of unnecessary cost directly compresses already-thin margins. |
| Scaling dynamics | Scales with relationship depth and account expansion. Revenue per customer grows over time. | Scales with distribution reach and operational efficiency. Unit economics must hold at every volume increment. |
The practical takeaway for founders: if you are entering a market with limited capital, premium pricing is often the better starting position. It requires fewer customers to reach profitability, provides larger margins to absorb early-stage mistakes, and generates the cash flow needed to invest in growth. Volume-based pricing requires scale to work, and scale requires capital. The exception is when network effects or viral distribution provide a path to rapid, low-cost customer acquisition.
Pricing Sensitivity Analysis
Before committing to a pricing strategy, founders should model the sensitivity of their economics to price changes. Pricing is the single highest-leverage variable in most business models, and small changes have outsized effects on profitability.
Consider a SaaS product that sells for $50/month, with a variable cost of $30 per customer and $100,000 in monthly fixed costs. At $50/month, each customer contributes $50 - $30 = $20/month, so you need 5,000 customers to break even. Now raise the price 20% to $60/month. Even if you lose 10% of your customers (4,500 remaining), the contribution per customer rises to $60 - $30 = $30/month (because the variable cost per customer does not rise with price), and total contribution increases from $100,000 to $135,000. You went from breakeven to $35,000 in monthly operating profit by raising the price and losing customers. This is counterintuitive to most founders, who fear any customer loss, but the math is clear: a price increase flows to the bottom line at a disproportionate rate because the variable cost per customer and the fixed costs do not change.
The reverse is equally important. A 10% price decrease to gain 15% more volume sounds like a good trade. But if your gross margin is 40%, you need roughly 33% more volume to maintain the same total gross profit. Most founders underestimate how much additional volume is required to offset a price cut, which is why discounting is one of the fastest ways to destroy a business model. I recommend founders model three scenarios before setting price: the base case, a 15-20% price increase with modeled volume loss, and a 15-20% price decrease with modeled volume gain. The exercise almost always reveals that the higher price point is more viable than the lower one for early-stage companies.
Model a price change and its volume response. The defaults reproduce a base case of $50 → $60 at a $30 variable cost, −10% customers, and +$35k profit.
Check Your Understanding
Knowledge Check 8
Unit Economics & LTV/CAC
A SaaS product sells for $50/month. Variable cost is $30 per customer, monthly fixed cost is $100,000, and the company has 5,000 customers, so it is currently at breakeven. The company raises price by 20% to $60/month, and 20% of customers leave. What happens to monthly operating profit?
Layer 4
Channel & Go-to-Market Strategy
How a business reaches its customers is as important as what it sells. The channel decision shapes customer acquisition cost, sales cycle length, support requirements, and ultimately unit economics. Getting the channel wrong is one of the most common reasons startups fail despite having a viable product.
B2B vs. B2C and the Convergence at the Extremes
B2B vs. B2C: The Core Distinction
The fundamental difference between B2B and B2C is the buying process. B2B purchases involve multiple stakeholders (finance, procurement, legal, end users), longer evaluation cycles, higher deal values, and decisions driven by ROI justification. B2C purchases involve individual consumers making faster decisions driven by a mix of need, emotion, convenience, and price.
| Dimension | B2B | B2C |
|---|---|---|
| Decision maker | Buying committee (3-10 people). Champions, influencers, procurement teams, budget holders, and blockers. | Individual consumer. Sometimes influenced by family, peers, or reviews. |
| Sales cycle | Weeks to months (enterprise: 6-18 months). Requires demos, pilots, procurement. | Minutes to days. Can be impulse or considered, but rarely exceeds weeks. |
| Customer acquisition | Direct sales, content marketing, conferences, partnerships, channel resellers. | Digital marketing, social media, SEO, brand advertising, retail placement. |
| Deal value | Higher per transaction ($1K-$1M+). Fewer customers, larger contracts. | Lower per transaction ($1-$500 typical). Many customers, smaller purchases. |
| Retention driver | Integration depth, switching costs, relationship management, contract renewals. | Brand loyalty, habit, convenience, ongoing value delivery. |
The Convergence at the Extremes
One of the most useful insights for founders: high-end B2C starts to resemble B2B, and low-end B2B starts to resemble B2C. A luxury goods company selling $50,000 watches operates more like a B2B sales motion than a consumer brand: relationship selling, personalized service, long consideration periods, and high-touch customer experience. Conversely, a B2B SaaS tool priced at $29/month acquires and retains customers more like a consumer app than an enterprise software company: self-serve signup, product-led growth, automated onboarding, and churn management through engagement metrics.
This convergence matters because it determines the go-to-market motion. Founders who price at the low end of B2B but build an enterprise sales team will burn through capital. Founders who price at the high end of B2C but rely on mass-market advertising will waste their marketing budget. Match the sales motion to the actual buying behavior at your price point, not to the category label.
The ACV-to-Sales-Motion Rule
Annual contract value (ACV) dictates the sales motion you can afford. This is not a suggestion; it is an economic constraint. Build a sales motion that is too expensive for your revenue model and you will destroy unit economics regardless of how good the product is.
| ACV Range | Viable Sales Motions | What You Typically Cannot Afford |
|---|---|---|
| < $1K / year | Self-serve, viral/referral, SEO, product-led growth, efficient paid acquisition, marketplace distribution | Inside sales reps, demos, free trials with human onboarding, most motions requiring a person to close each deal |
| $1K-$25K / year | Inside sales, webinars, partnerships, founder-led sales, content marketing with conversion funnels | Enterprise field sales teams, long procurement cycles, custom implementations per customer |
| $25K-$100K+ / year | Enterprise sales (AEs, SEs), procurement and legal review, pilots, customer success teams, channel partnerships | Mass-market advertising, self-serve only (customers expect hand-holding at this price) |
Check Your Understanding
Knowledge Check 9
Unit Economics & LTV/CAC
A product has a $900 annual contract value. Which go-to-market motion is economically viable?
Adoption Friction and Channel Strategy by Revenue Model
Adoption Friction: Why the Best Product Does Not Always Win
Porter, VRIO, and Blue Ocean (covered in Layer 6) assess competitive dynamics at the industry and firm level. But startups often die from something more mundane: customer behavior does not change. The product may be better, but switching costs, procurement processes, training requirements, compliance reviews, integration dependencies, organizational habits, or internal politics block adoption.
When assessing any business opportunity, I ask four adoption friction questions:
- Why now? What has changed in the market, technology, or regulation that makes this the right moment? If nothing has changed, the existing solution will persist through inertia.
- What behavior must change? Most new products require someone to stop doing something one way and start doing it another way. The bigger the behavioral change required, the harder adoption tends to be, even when the product is superior.
- Who loses power or budget if this product wins? New tools often threaten existing roles, teams, or vendor relationships inside the buyer's organization. Those stakeholders will resist, sometimes openly, sometimes by stalling procurement.
- What must be integrated, approved, trained, migrated, or replaced? Technical integration costs, IT security reviews, data migration, user training, and compliance approvals all add friction. Each one is a potential deal-killer for an early-stage company without the resources to support complex deployments.
Channel Strategy by Revenue Model
- Product: Direct-to-consumer (e-commerce, owned retail), wholesale distribution, retail partnerships. Nike uses all three, with DTC growing as a strategic priority because it captures more margin and customer data.
- Services: Referral networks, professional associations, thought leadership (content, speaking, publishing), strategic partnerships. Services sell on trust, which requires credibility signals.
- IP/Licensing: Direct sales for enterprise, self-serve for SMB, app stores and distribution platforms for consumer. The channel should match the price point and complexity of the product.
- Marketplace: Dual-sided acquisition: you need to build supply and demand simultaneously. Geographic density matters. Uber struggles to work in a city with 50 drivers; it typically needs thousands.
- Advertising: The channel IS the product. Build the audience first through organic growth, content, or utility, then monetize with ads. Monetization rarely works before the audience reaches scale.
The Unit Economics Bridge
Unit economics answers the most fundamental question in business finance: does each transaction create economic value? If the cost of acquiring and serving a customer exceeds the revenue that customer generates, the business destroys value at scale. Growth accelerates the destruction. This is where many venture-backed startups fail: they achieve impressive revenue growth while losing money on every customer, hoping that scale will eventually fix the economics. It usually does not.
Most students and many founders calculate "gross margin" and stop there. That is where fake unit economics hide. A proper unit economics analysis requires a layered bridge that captures all the costs between revenue and true per-unit profitability:
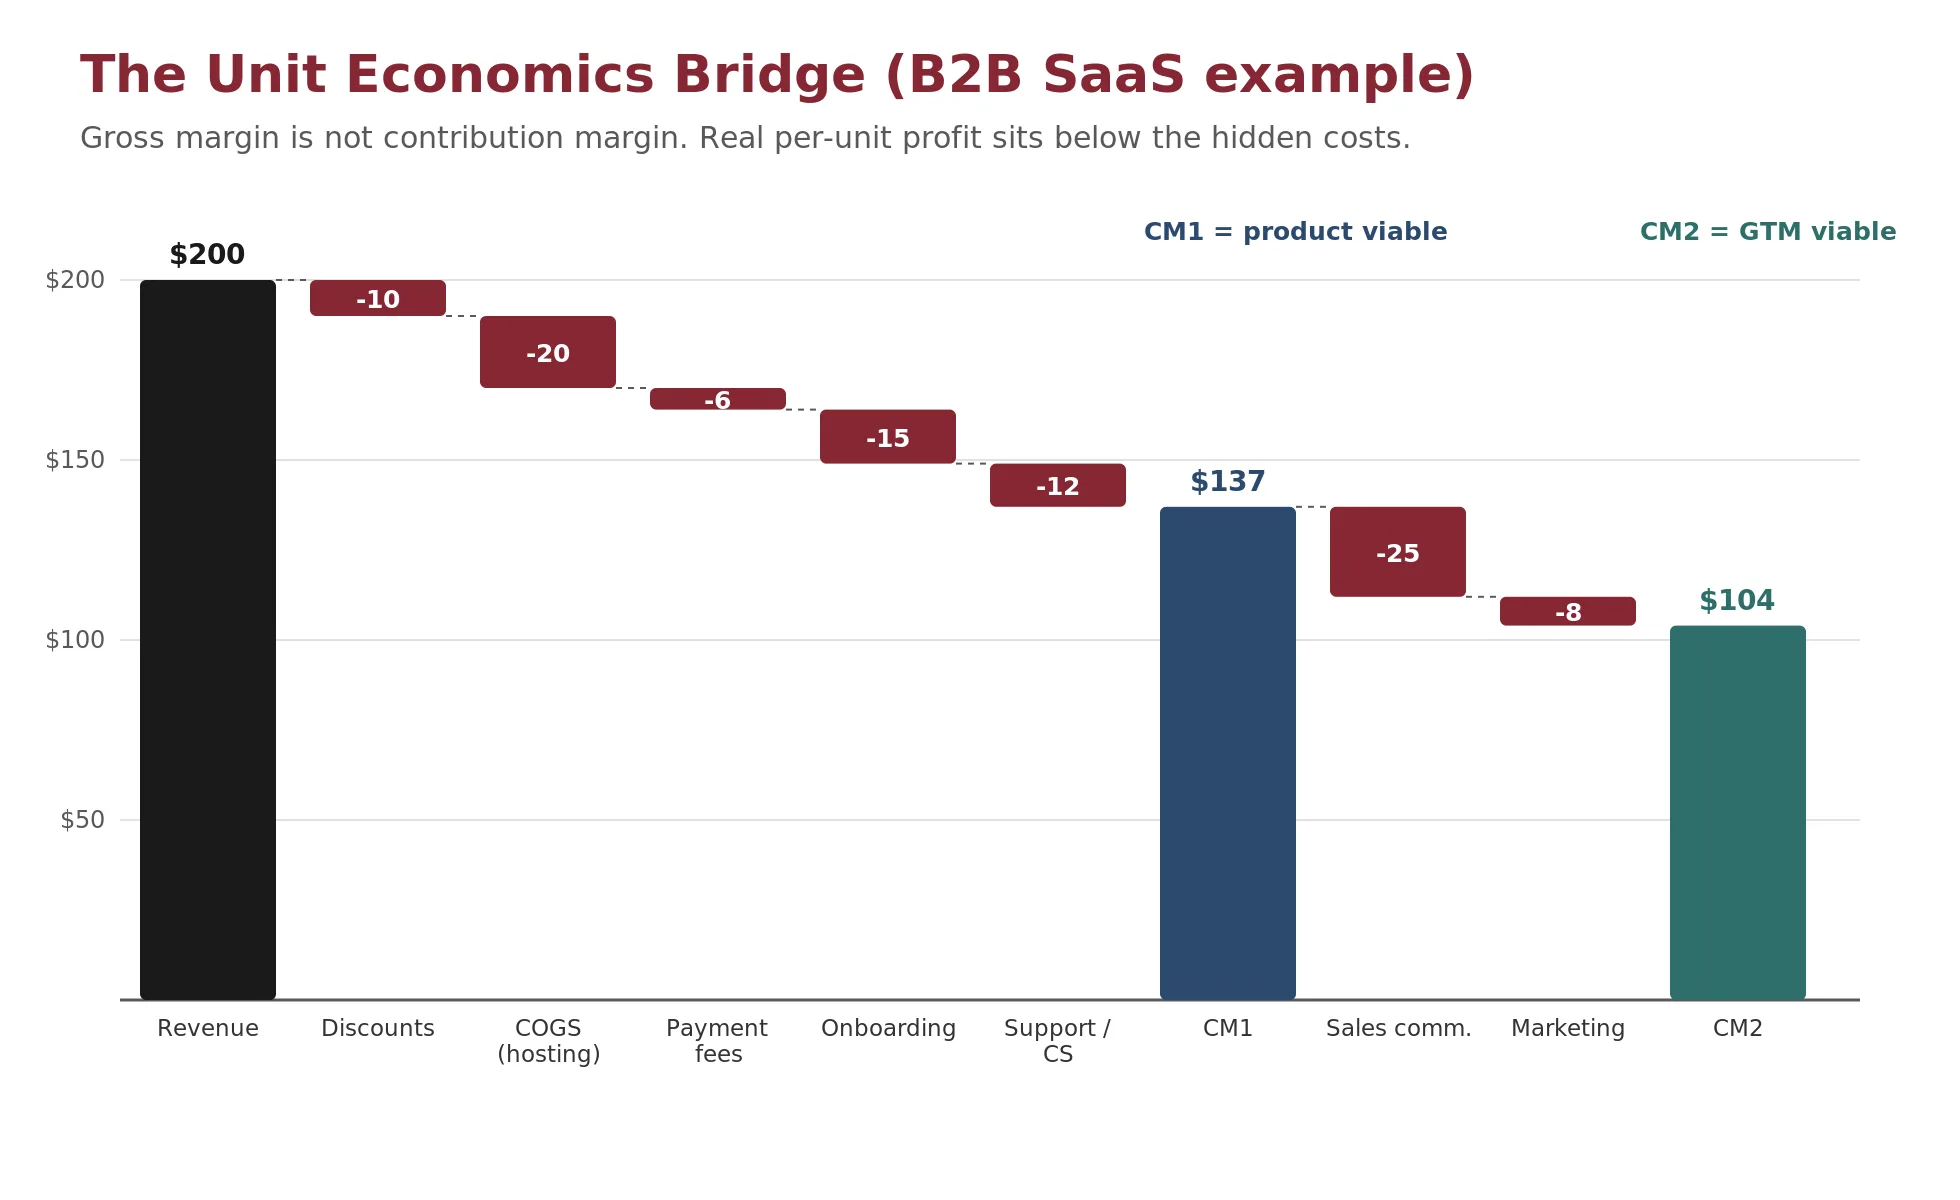
| Line Item | Example (B2B SaaS) |
|---|---|
| Revenue per unit (monthly) | $200 |
| minus discounts, refunds, credits | ($10) |
| minus COGS (hosting, infrastructure) | ($20) |
| minus payment processing / platform fees | ($6) |
| minus onboarding / implementation cost (amortized) | ($15) |
| minus ongoing support / customer success (allocated) | ($12) |
| = Contribution Margin 1 (CM1) | $137 (68.5%) |
| minus variable sales commission (allocated per deal) | ($25) |
| minus variable marketing cost (allocated per deal) | ($8) |
| = Contribution Margin 2 (CM2) | $104 (52.0%) |
CM1 tells you whether the product itself is economically viable after all direct delivery costs. CM2 tells you whether the business can profitably acquire and serve customers after accounting for the variable costs of sales and customer success. A business with a positive CM1 but negative CM2 has a product that works but a go-to-market motion that destroys the economics.
The costs that hide between gross margin and true contribution margin include: onboarding and implementation, ongoing customer support, customer success management, refunds and chargebacks, warranty costs, fraud and failed payments, marketplace incentives, sales commissions, and returns processing. In my experience, founders who skip these costs overestimate their unit economics by 20-40%.
Check Your Understanding
Knowledge Check 10
Unit Economics & LTV/CAC
A business has positive CM1 (contribution margin after all direct delivery costs such as hosting, support, and onboarding) but negative CM2 (that same margin after also subtracting variable sales commission and marketing cost per deal). What does this mean?
Core Unit Economics Metrics
| Metric | Formula | What It Tells You |
|---|---|---|
| Customer Acquisition Cost (CAC) | Total Sales & Marketing Expense / New Customers Acquired (in period) | How much it costs to win one customer. Include all fully-loaded costs: salaries, ad spend, tools, content, events. |
| Customer Lifetime Value (LTV) | Average Revenue Per Customer x Gross Margin % x Average Customer Lifespan (or / Churn Rate) | Total gross profit from a customer over the entire relationship. The economic value of a customer. |
| LTV:CAC Ratio | LTV / CAC | Below 1:1 = losing money on every customer. 3:1 = healthy benchmark (SaaS industry standard). Above 5:1 = may be underinvesting in growth. |
| CAC Payback Period | CAC / (Monthly Revenue Per Customer x Gross Margin %) | Months to recover the cost of acquiring one customer. Under 12 months is strong; over 18 months is a cash flow risk. |
| Net Revenue Retention (NRR) | (Starting MRR + Expansion - Contraction - Churn) / Starting MRR | Whether existing customers spend more or less over time. Above 100% means the business grows even without new customers. Top SaaS companies achieve 120-140%. |
| Contribution Margin | Revenue Per Unit - All Variable Costs Per Unit | The profit from each unit sold before fixed costs. Must be positive for the business to ever reach profitability. Use CM2 for the real picture. |
| Burn Rate | Total Monthly Cash Outflows - Total Monthly Cash Inflows | Net cash consumed per month. Gross burn = total spend. Net burn = spend minus revenue. |
| Burn Multiple | Net Burn / Net New ARR | How much cash is consumed to generate each dollar of new ARR. Below 1x = exceptional. 1-2x = strong. Above 3x = inefficient growth. Introduced by David Sacks (2020) and now standard at growth-stage evaluations. Bessemer Venture Partners publishes related efficiency benchmarks. |
| Runway | Cash on Hand / Monthly Net Burn Rate | Months of cash remaining at current burn. Below 6 months = urgent. 12-18 months = healthy for fundraising. |
Gross Margin Benchmarks by Revenue Model
Gross margin is one of the most important indicators of business model quality, though it does not tell the whole story on its own. A high-gross-margin business with terrible retention, inefficient customer acquisition, or excessive capital intensity can still be a weak business. That said, gross margin determines how much of each revenue dollar is available to cover operating expenses, fund growth, and generate profit, and it is the first place I look when assessing a new business model. Benchmarks vary significantly by revenue model:
| Revenue Model | Typical Gross Margin | What Drives It |
|---|---|---|
| SaaS / IP Licensing | 70-90% | Near-zero marginal cost after R&D. Hosting and support are the primary COGS items. |
| Marketplace / Platform | 60-80% | Revenue is the take rate, so COGS is mainly payment processing, insurance, and trust & safety. |
| Professional Services | 50-80% | Depends on utilization rates and billing rates. High-end advisory (60-80%); staffing models (30-50%). |
| Advertising / Media | 55-75% | Traffic acquisition costs and content costs are primary COGS. Scales well once audience is built. |
| Physical Products | 30-60% | Materials, manufacturing, shipping, packaging. Premium brands (Nike, Apple) achieve higher end through pricing power. |
| Hardware + Software | 35-55% | Hardware compresses margins; recurring software revenue lifts blended margin over time. |
Composite Efficiency Metrics: The Rule of 40 and the Magic Number
The burn multiple asks how much cash the whole company consumes for each dollar of new ARR. Two other composite metrics are commonly used alongside it to judge how efficiently a company converts spending into growth. Both are rules of thumb rather than laws, and both are most informative for subscription businesses with enough revenue history for the inputs to be stable.
The Rule of 40
The Rule of 40 holds that a healthy SaaS company's revenue growth rate plus its profit margin (both in percentage points, with the margin usually measured as free cash flow or EBITDA margin) should sum to about 40 or more. The rule captures a tradeoff: a company can grow fast while losing money, or grow slowly while profitable, and either mix can be healthy as long as the two together clear the bar. A one-line worked example: a company growing revenue 30% per year with a 5% profit margin scores 30 + 5 = 35, below the 40 benchmark. The margin term can be negative, so a company growing 55% with a negative 10% margin scores 45 and clears the bar despite its losses. Treat the threshold as a screening convention popularized by SaaS investors rather than a pass-fail test; market conditions shift how much weight investors place on the growth term versus the margin term.
The SaaS Magic Number
The magic number isolates sales efficiency: how much annualized net new revenue each dollar of sales and marketing spend produces. Take the increase in quarterly recurring revenue, multiply it by 4 to annualize it into net new ARR, and divide by the prior quarter's sales and marketing spend (the prior quarter, because spend generally takes at least a quarter to show up as revenue). A worked example: quarterly revenue rises from $500,000 to $600,000, and the prior quarter's sales and marketing spend was $500,000. Net new ARR is $100,000 x 4 = $400,000, so the magic number is $400,000 / $500,000 = 0.8. A common reading treats a magic number above roughly 0.75 as efficient enough to justify continued or increased go-to-market investment, and below roughly 0.5 as inefficient, a signal to fix the sales motion before adding spend. These cutoffs are rules of thumb; sales-cycle length, gross margin, and payback period all shift where the line should sit for a given business.
Worked Example: Healthy SaaS Unit Economics
Consider a B2B SaaS company with the following characteristics:
- Monthly subscription: $200/month ($2,400/year)
- Average customer lifespan: 3 years (implied monthly churn rate: ~2.8%)
- Gross margin: 80%
- Monthly sales & marketing spend: $50,000
- New customers acquired per month: 25
- CAC = $50,000 / 25 = $2,000 per customer
- LTV = $200/month x 80% gross margin x 36 months = $5,760
- LTV:CAC = $5,760 / $2,000 = 2.88:1
- CAC Payback = $2,000 / ($200 x 0.80) = 12.5 months
This company is close to the 3:1 benchmark but could improve. The 12.5-month payback period means the company needs 12.5 months of cash to "float" each new customer acquisition before that customer becomes profitable. At 25 new customers per month, the company needs to front $50,000/month in acquisition costs that will not be recovered for over a year. This is why SaaS companies burn cash during growth phases, and why runway management is critical.
Adjust the inputs. The defaults reproduce the worked example. Push monthly churn from 2.8% toward 6% to watch LTV and LTV:CAC collapse.
Worked Example: How Churn Quietly Destroys LTV
Now take the exact same company, but change one variable: monthly churn rate increases from 2.8% to 6%.
- Monthly subscription: $200/month
- Gross margin: 80%
- CAC: $2,000
- Monthly churn: 6% (average lifespan drops from 36 months to ~17 months)
- LTV = $200/month x 80% x 16.7 months = $2,672
- LTV:CAC = $2,672 / $2,000 = 1.34:1
- CAC Payback = 12.5 months (unchanged, but most customers leave before month 17)
The company still has 80% gross margins, still charges $200/month, and still acquires customers at the same cost. From a revenue growth chart, it might look identical. But the LTV:CAC ratio collapsed from 2.88:1 to 1.34:1, barely above break-even. The business is now marginally profitable per customer on paper but has almost no margin of safety for any operational inefficiency, price pressure, or increase in acquisition cost.
This is why churn is the silent killer of subscription businesses. A 3-point difference in monthly churn (2.8% vs. 6%) cuts customer lifetime roughly in half and makes the difference between a fundable business and one that is slowly bleeding to death. Most investors I work with look at churn before almost anything else in a SaaS company.
One simplification to flag before moving on: the LTV used here sums a customer's future gross margin undiscounted, as if a dollar of margin in month 30 were worth the same as a dollar today. It is not: a dollar arriving years later is worth less, which is exactly the time-value machinery Week 5 develops for discounted cash flow. A fully rigorous LTV discounts each future month's margin back to the present, which lowers the figure, especially for long-lived, slowly-churning customers. The undiscounted version is the standard board-deck convention and is fine for comparing options and stress-testing churn, but read a headline LTV as an upper bound, and treat the LTV:CAC ratio as a screen, not a precise valuation.
Check Your Understanding
Knowledge Check 11
Unit Economics & LTV/CAC
Two SaaS companies are identical ($200/month subscription, 80% gross margin, $2,000 CAC) except monthly churn is 2.8% versus 5%. Approximating average customer lifetime as 1 divided by the monthly churn rate, what is the main effect of the higher churn?
Cohort Economics: Moving Beyond Static LTV:CAC
LTV:CAC is useful as a headline metric, but it can be misleading if treated as a single static ratio. A more rigorous approach tracks unit economics by customer cohort, the group of customers acquired in a given month, and watches how their economics evolve over time.
The key cohort metrics to track
- Blended CAC vs. paid CAC: Blended CAC includes organic and referral customers in the denominator, making acquisition look cheaper than it is. Paid CAC isolates the cost of customers acquired through paid channels. As you scale, organic growth slows and paid CAC dominates, so blended CAC understates the real cost of growth.
- CAC by channel: Not all channels perform equally. Google Ads might produce customers at $1,500 CAC while LinkedIn produces them at $3,500. Track separately to allocate spend to the best-performing channels.
- Gross retention vs. net revenue retention: Gross retention measures what percentage of revenue you keep from existing customers (ignoring expansion). Net revenue retention includes upsells and expansion. A company with 85% gross retention and 130% NRR has a churn problem masked by expansion revenue from its best customers.
- Monthly logo churn vs. revenue churn: Losing 5% of customers per month is very different if they are your smallest customers (low revenue churn) versus your largest (high revenue churn). Track both.
- Expansion revenue by cohort: Are January's customers spending more by June? If expansion revenue grows over time within each cohort, the business has strong product-market fit and a natural upsell motion.
- Margin by cohort after onboarding: The first month of a customer relationship often has the worst margins due to onboarding, implementation, and support costs. Track whether margins improve as the relationship matures. If they do not, the cost structure has a problem.
Check Your Understanding
Knowledge Check 12
Unit Economics & LTV/CAC
A board deck shows blended LTV:CAC of 4.1:1, but paid-only LTV:CAC is 1.6:1 and monthly logo churn is 4.8%. What is the most accurate read?
Default Alive or Default Dead
Paul Graham, co-founder of Y Combinator, asks every startup a single diagnostic question: are you default alive or default dead? The question is simple: given your current revenue growth rate and your current expense run rate, will you reach profitability before you run out of cash? If yes, you are default alive. If no, you are default dead.
A default alive company may still be burning cash, but its growth trajectory will carry it to profitability before the bank account hits zero. A default dead company is on a path where expenses outpace revenue growth, and without additional funding, the business will fail. The most dangerous version of default dead is what Graham calls the "fatal pinch": the company is burning too much, growing too slowly, and does not have enough runway to fix either problem before running out of money.
The most common cause of the fatal pinch is over-hiring. Founders raise a round, hire aggressively, and lock in a high burn rate before the revenue growth materializes. I recommend that founders recalculate their default alive/dead status monthly and treat it as the single most important diagnostic in the business until profitability is achieved.
Test whether a venture is default alive or default dead, and see current and worst-case runway.
Layer 6
Market Sizing & Competitive Position
Even a business with strong unit economics will fail if the market is too small to support it or if competitive dynamics make it impossible to win. Market sizing quantifies the opportunity. Competitive analysis assesses whether the business can capture and defend a meaningful share of it.
TAM, SAM, SOM: Sizing the Market
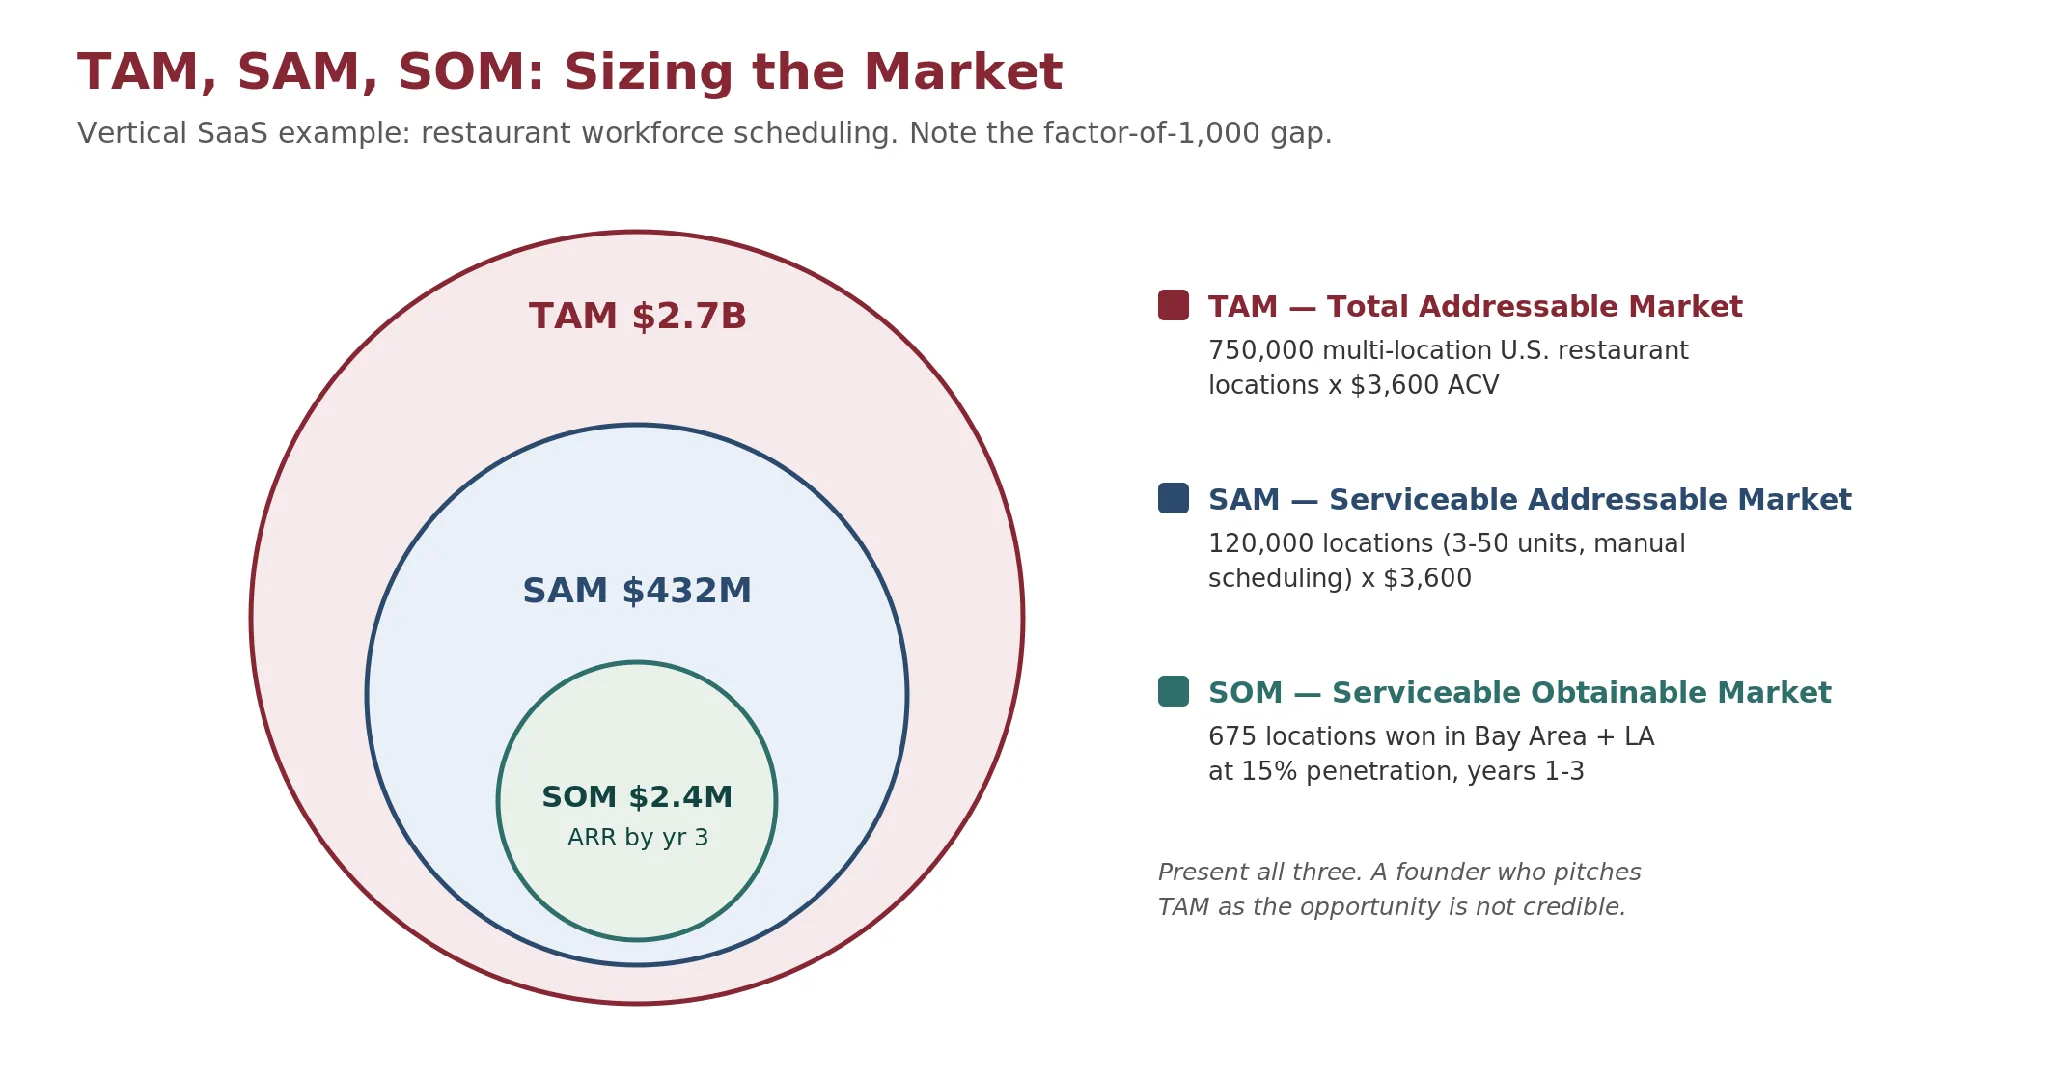
The standard framework for market sizing uses three concentric layers. For students, the most common mistake is conflating TAM with realistic revenue potential. Investors see through inflated market sizes; credible market sizing requires honest, bottom-up analysis.
| Layer | Definition | How to Calculate |
|---|---|---|
| TAM (Total Addressable Market) | The total revenue opportunity if the company captured 100% of its market with no competition. | Number of potential customers x average annual revenue per customer. Use industry reports, census data, or extrapolation. |
| SAM (Serviceable Addressable Market) | The portion of TAM that the company's specific product and business model can realistically serve. | Filter TAM by geography, customer segment, distribution reach, and product fit. Remove segments the business cannot or will not serve. |
| SOM (Serviceable Obtainable Market) | The realistic share of SAM the company can capture in a defined timeframe given competitive dynamics and go-to-market capacity. | SAM x realistic market share % based on competitive position, distribution capacity, and growth rate. For startups, 1-5% of SAM in years 1-3 is often credible. |
Top-down vs. bottom-up
Aswath Damodaran (NYU Stern) emphasizes that credible market sizing uses both approaches and checks them against each other. Top-down starts with industry-level data and works down. Bottom-up starts with the number of customers you can realistically reach and works up. If your top-down and bottom-up estimates diverge significantly, investigate why before presenting either number.
Worked Example: Sizing a Vertical SaaS Market
The following is an illustrative example with simplified assumptions to demonstrate the methodology. Consider a hypothetical startup building scheduling and workforce management software for multi-location restaurant groups in the United States. Here is how a credible bottom-up market sizing works:
TAM
There are approximately 750,000 restaurant locations in the U.S. that are part of multi-location groups (chains, franchises, and multi-unit independents). If the average annual contract value is $3,600 per location ($300/month), the TAM is $2.7 billion.
SAM
The product targets groups with 3-50 locations that currently manage scheduling manually or with spreadsheets, excluding enterprise chains (which use established vendors like Kronos or UKG) and single-location restaurants (which do not have the complexity to justify the product). This filters to roughly 120,000 locations across approximately 15,000 restaurant groups. SAM = 120,000 x $3,600 = $432 million.
SOM
In years 1-3, the startup can realistically serve the San Francisco Bay Area and Los Angeles metro markets through founder-led sales and local partnerships. Approximately 4,500 qualifying locations exist in those two markets. At a 15% penetration rate over three years (aggressive but credible with a strong product), SOM = 675 locations x $3,600 = $2.4 million in ARR by year three.
Notice how different the SOM ($2.4 million) is from the TAM ($2.7 billion). That factor-of-1,000 gap is normal and honest. A founder who presents the $2.7 billion number as their market opportunity is not being credible. A founder who presents the $2.4 million near-term target with a clear path to expand geographically, add adjacent verticals (hotels, healthcare facilities), and increase ACV through product expansion is telling a story investors can underwrite.
Build a bottom-up TAM/SAM/SOM. The defaults reproduce the restaurant-scheduling worked example (TAM $2.7B, SAM $432M, SOM $2.4M).
Check Your Understanding
Knowledge Check 13
Market Sizing (TAM/SAM/SOM)
A founder pitches a $12 trillion global construction market as the opportunity for construction project-management software. What is the credibility problem?
Beachhead Strategy, the Chasm, and Wedge Analysis
A credible startup usually does not attack the whole TAM at once. It starts with a beachhead: a narrow customer segment where pain is high, adoption is easier, and the product can win decisively. The beachhead becomes the wedge that opens adjacent segments over time.
Geoffrey Moore's Crossing the Chasm (1991) provides the essential framework for understanding why beachheads matter. Moore observed that technology adoption follows a predictable sequence: innovators and early adopters embrace new products based on vision and potential, but the early majority (the mass market) requires proof, references, and whole-product solutions before they will buy. The gap between early adopters and the early majority is the “chasm,” and it kills more startups than competition does. A company with 50 enthusiastic early adopters can still fail completely if it cannot cross into the pragmatist majority.
Moore's prescription is the bowling alley strategy: dominate one narrow niche (one “pin”) so thoroughly that you become the default choice, then use that reference base to knock over adjacent niches. Each conquered niche provides the case studies, integrations, and word-of-mouth credibility that pragmatist buyers in the next niche require. This is why the beachhead should be narrow enough to dominate, not just enter. A startup that is “kind of used” by customers in ten verticals has less chasm-crossing power than one that is indispensable to customers in one vertical.
Five questions for evaluating a startup's market strategy
When evaluating a startup's market strategy, I ask five questions:
- Who is the first painfully specific customer? Not “small businesses” but “three-location restaurant groups in urban markets with 50-200 employees who currently manage scheduling in spreadsheets.” The more specific, the more credible.
- Why will they buy now? What is the triggering event or urgency? Regulatory change, technology shift, competitive pressure, or cost crisis?
- What narrow use case gets adoption? The initial product does not need to do everything. It needs to do one thing so well that the customer is unlikely to go back to the old way.
- What adjacent segment does this unlock next? Once the beachhead is won, what is the natural expansion path? Geographic expansion, vertical expansion, or horizontal feature expansion?
- What does the business become if the wedge works? The long-term vision should be larger than the beachhead, but the beachhead should be winnable with the capital and team available today.
Competitive Analysis Frameworks
Three complementary frameworks assess competitive dynamics at different levels:
Porter's Five Forces (1979)
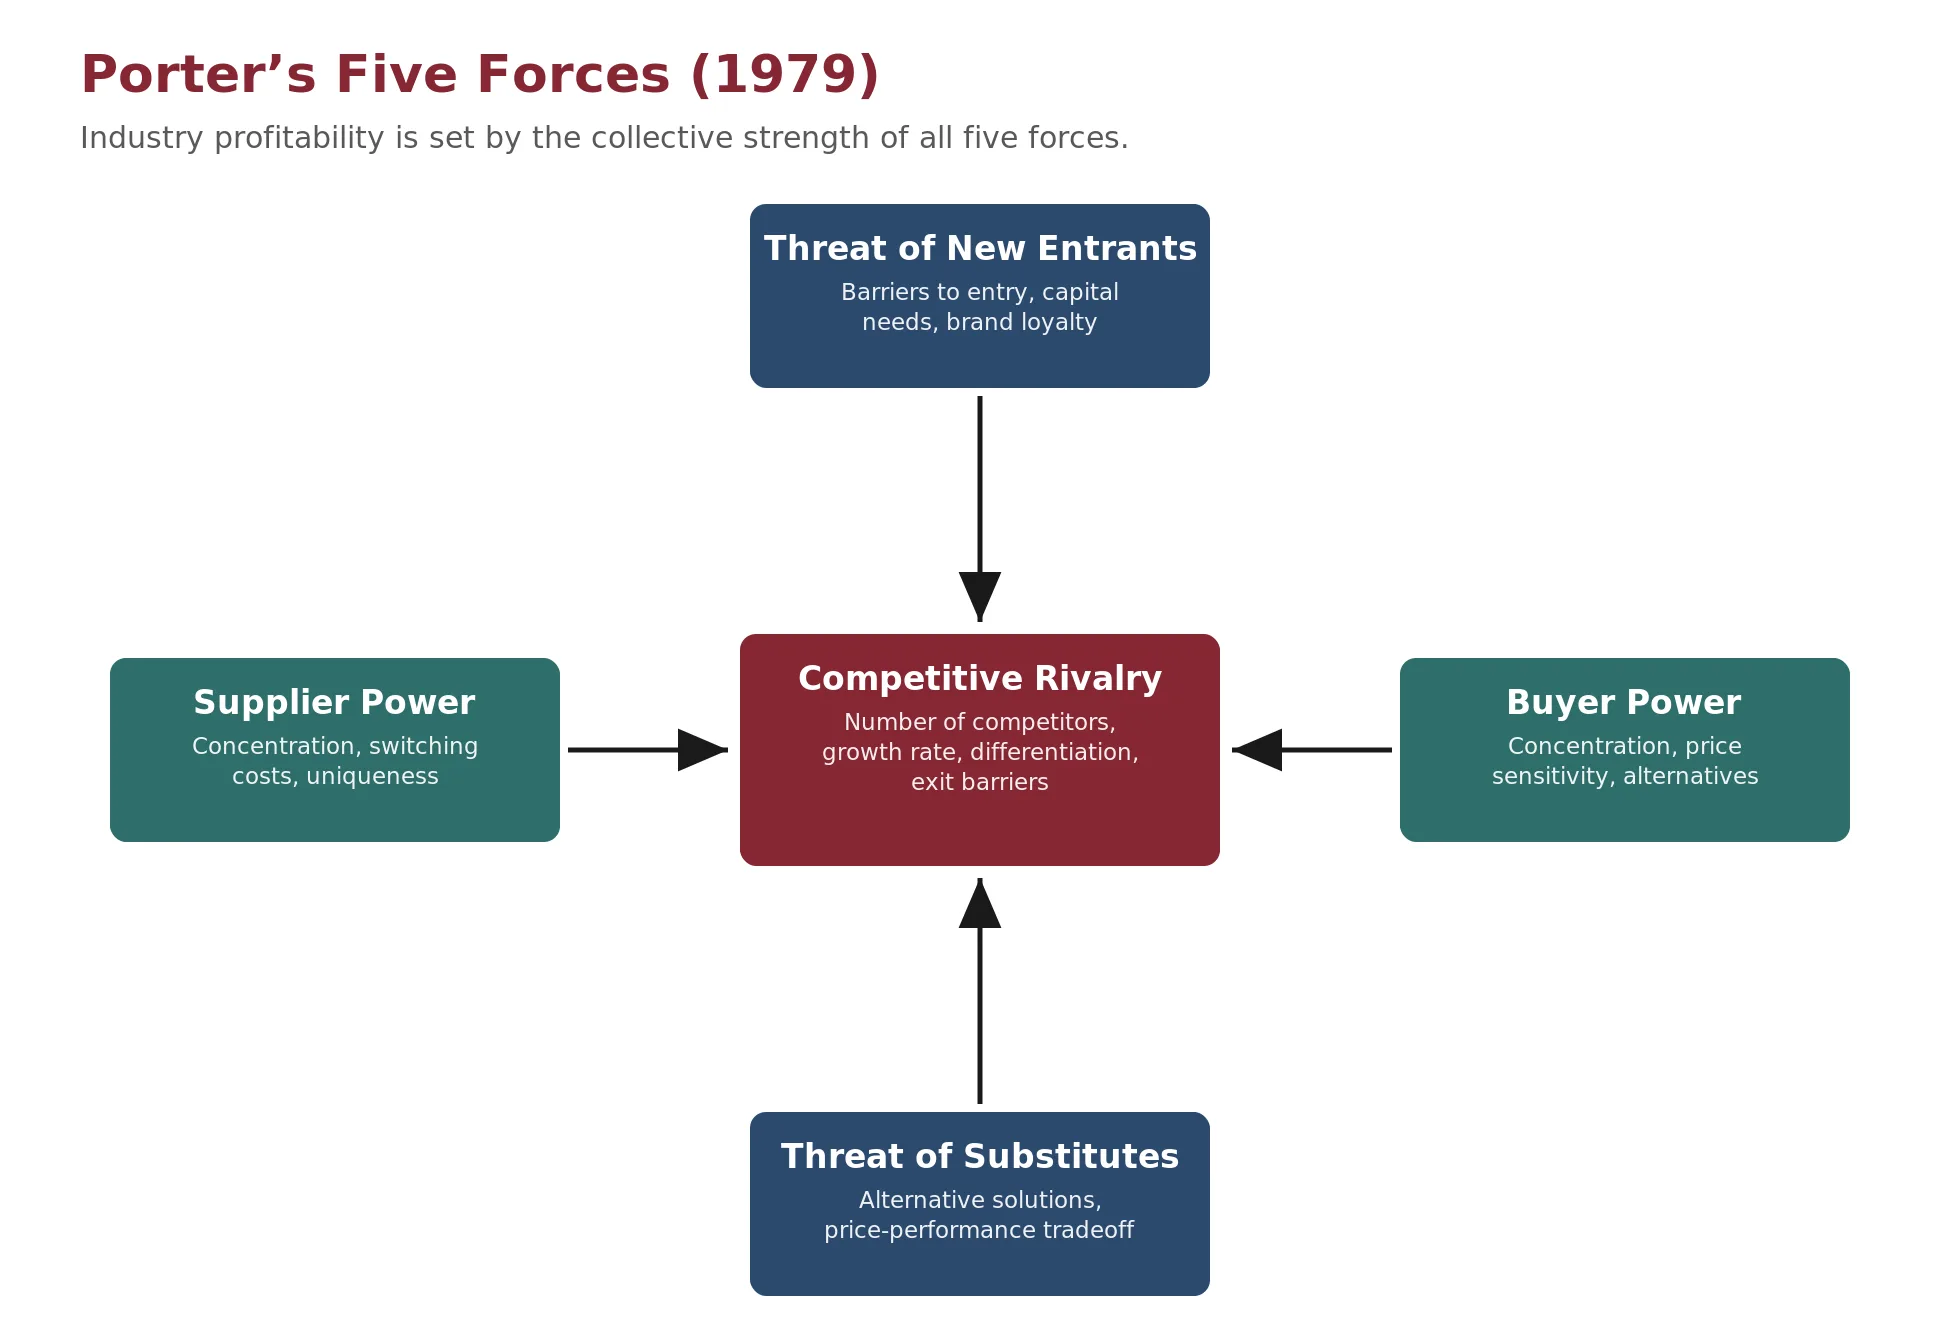
Michael Porter's framework assesses industry attractiveness through five competitive forces: (1) threat of new entrants, (2) bargaining power of suppliers, (3) bargaining power of buyers, (4) threat of substitutes, and (5) competitive rivalry among existing firms. Industries where all five forces are weak (high barriers to entry, low buyer power, few substitutes) are structurally attractive. Industries where multiple forces are strong compress margins for most participants.
For startup founders, the Five Forces analysis answers: is this an industry where a company can make money? A brilliant business in a structurally unattractive industry will often struggle. Conversely, even a mediocre business in a structurally attractive industry can generate strong returns.
| Competitive force | What to assess |
|---|---|
| Threat of new entrants | Barriers to entry, capital requirements, brand loyalty |
| Supplier power | Concentration, switching costs, uniqueness |
| Buyer power | Concentration, price sensitivity, alternatives |
| Threat of substitutes | Alternative solutions, price-performance tradeoff |
| Competitive rivalry | Number of competitors, growth rate, differentiation, exit barriers |
VRIO Framework (Barney, 1995)
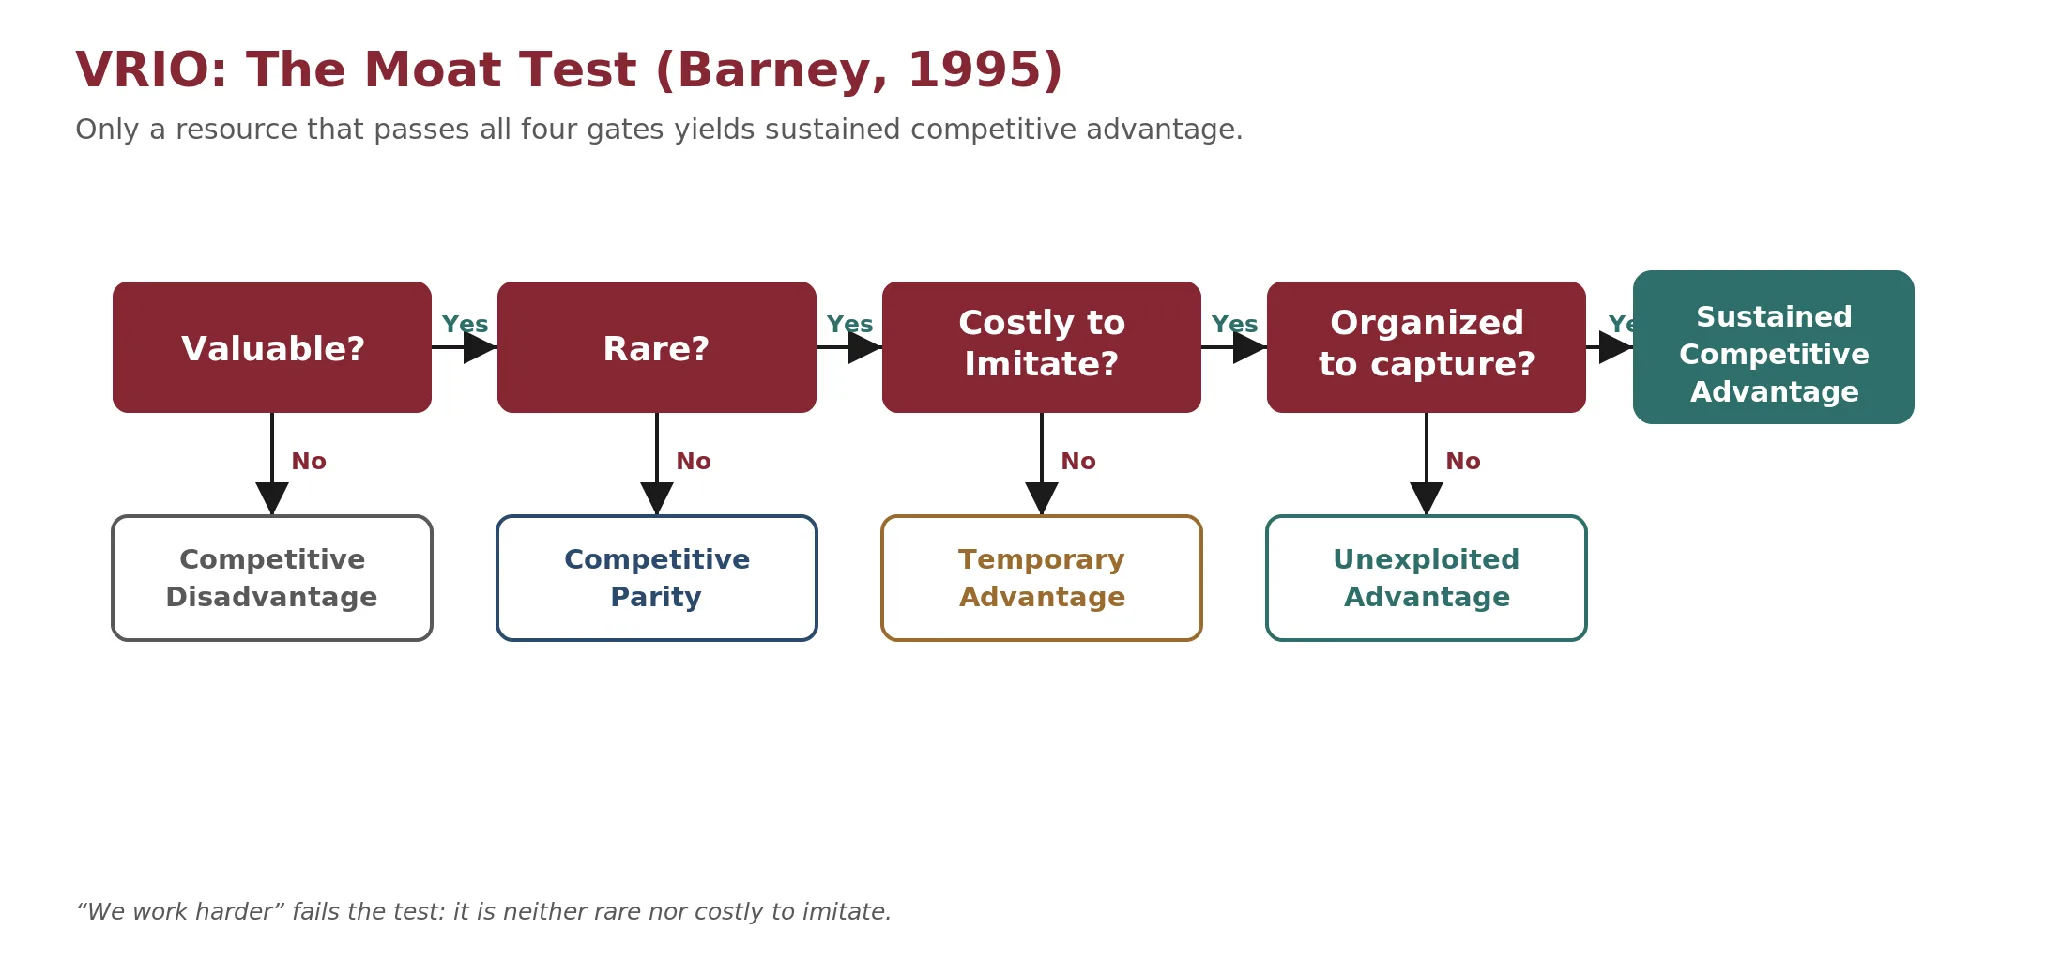
Jay Barney's resource-based view asks whether a firm's competitive advantages are sustainable. The VRIO framework evaluates each resource or capability on four criteria: Is it Valuable (does it enable the firm to exploit opportunities or neutralize threats)? Is it Rare (do few competitors possess it)? Is it costly to Imitate? Is the firm Organized to capture value from it? Only resources that pass all four tests produce sustained competitive advantage. Barney’s 1991 paper set out the earlier VRIN test (valuable, rare, imperfectly imitable, non-substitutable); the VRIO formulation, which replaces non-substitutability with organization, was developed by Barney in 1995.
For founders, VRIO is the moat assessment. What do you have that competitors cannot easily replicate? Proprietary technology, network effects, data advantages, regulatory licenses, brand equity, and deep customer relationships are common sources of VRIO-passing advantages. “We work harder” and “we have a better team” do not pass the VRIO test because they are neither rare nor costly to imitate.
| Valuable? | Rare? | Costly to Imitate? | Organized? |
|---|---|---|---|
| No | n/a | n/a | Competitive Disadvantage |
| Yes | No | n/a | Competitive Parity |
| Yes | Yes | No | Temporary Advantage |
| Yes | Yes | Yes | Sustained Advantage |
Blue Ocean Strategy (Kim & Mauborgne, 2005)
W. Chan Kim and Renee Mauborgne's Blue Ocean Strategy argues that the most profitable growth comes not from competing harder in existing markets (“red oceans” bloody with competition) but from creating entirely new market spaces (“blue oceans”) where competition is irrelevant. Blue ocean strategy uses value innovation: simultaneously pursuing differentiation and low cost by eliminating and reducing factors the industry competes on while raising and creating factors the industry has never offered.
For startup assessment, Blue Ocean thinking asks: is this founder competing head-to-head in an existing market (red ocean), or have they identified a way to redefine the competitive landscape? Businesses that compete solely on being cheaper or slightly better in an established category face an uphill battle. Businesses that redefine what customers value can create uncontested market space.
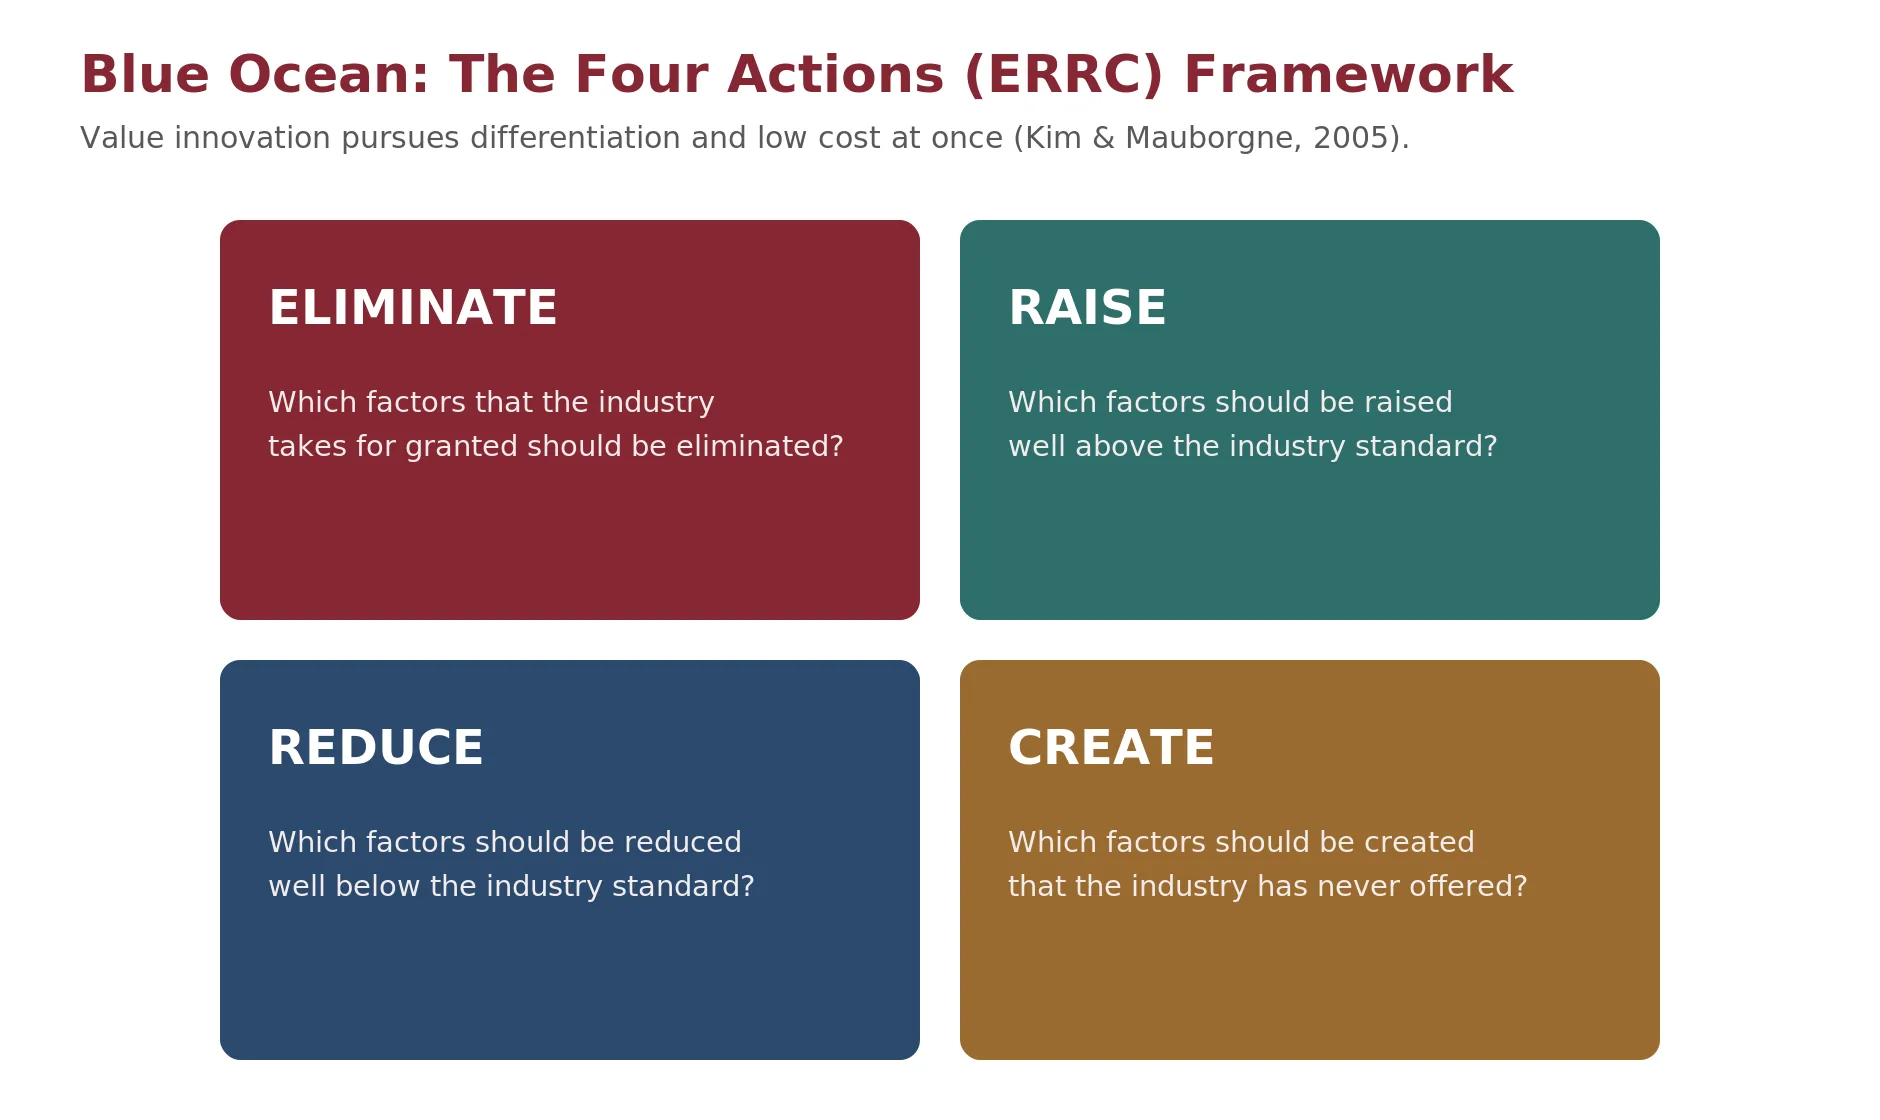
| ELIMINATE: Which factors that the industry takes for granted should be eliminated? | RAISE: Which factors should be raised well above the industry standard? |
| REDUCE: Which factors should be reduced well below the industry standard? | CREATE: Which factors should be created that the industry has never offered? |
Network Effects as Competitive Moat
Network effects deserve special attention because they are among the most powerful and most misunderstood sources of competitive advantage for startups. A network effect exists when a product or service becomes more valuable to each user as more users adopt it. Direct network effects occur when users benefit from other users on the same side (a messaging app is more useful when your contacts are on it). Indirect network effects occur when users on one side benefit from growth on another side (more Uber drivers make the platform more valuable to riders, and vice versa).
Network effects create defensibility because they make the product harder to displace as it grows. A competitor cannot simply build a better product; they also have to replicate the network, which is a much harder problem. However, founders frequently claim network effects where none exist. A product that happens to have many users does not have network effects unless each additional user genuinely increases the value for existing users. A SaaS tool used by 10,000 independent companies has scale, not network effects. A marketplace where 10,000 buyers attract more sellers, who in turn attract more buyers, has a real network effect. When assessing network effects, I ask: if I removed 30% of the user base overnight, would the remaining users notice a decrease in product value? If the answer is no, this is not a network-effect business.
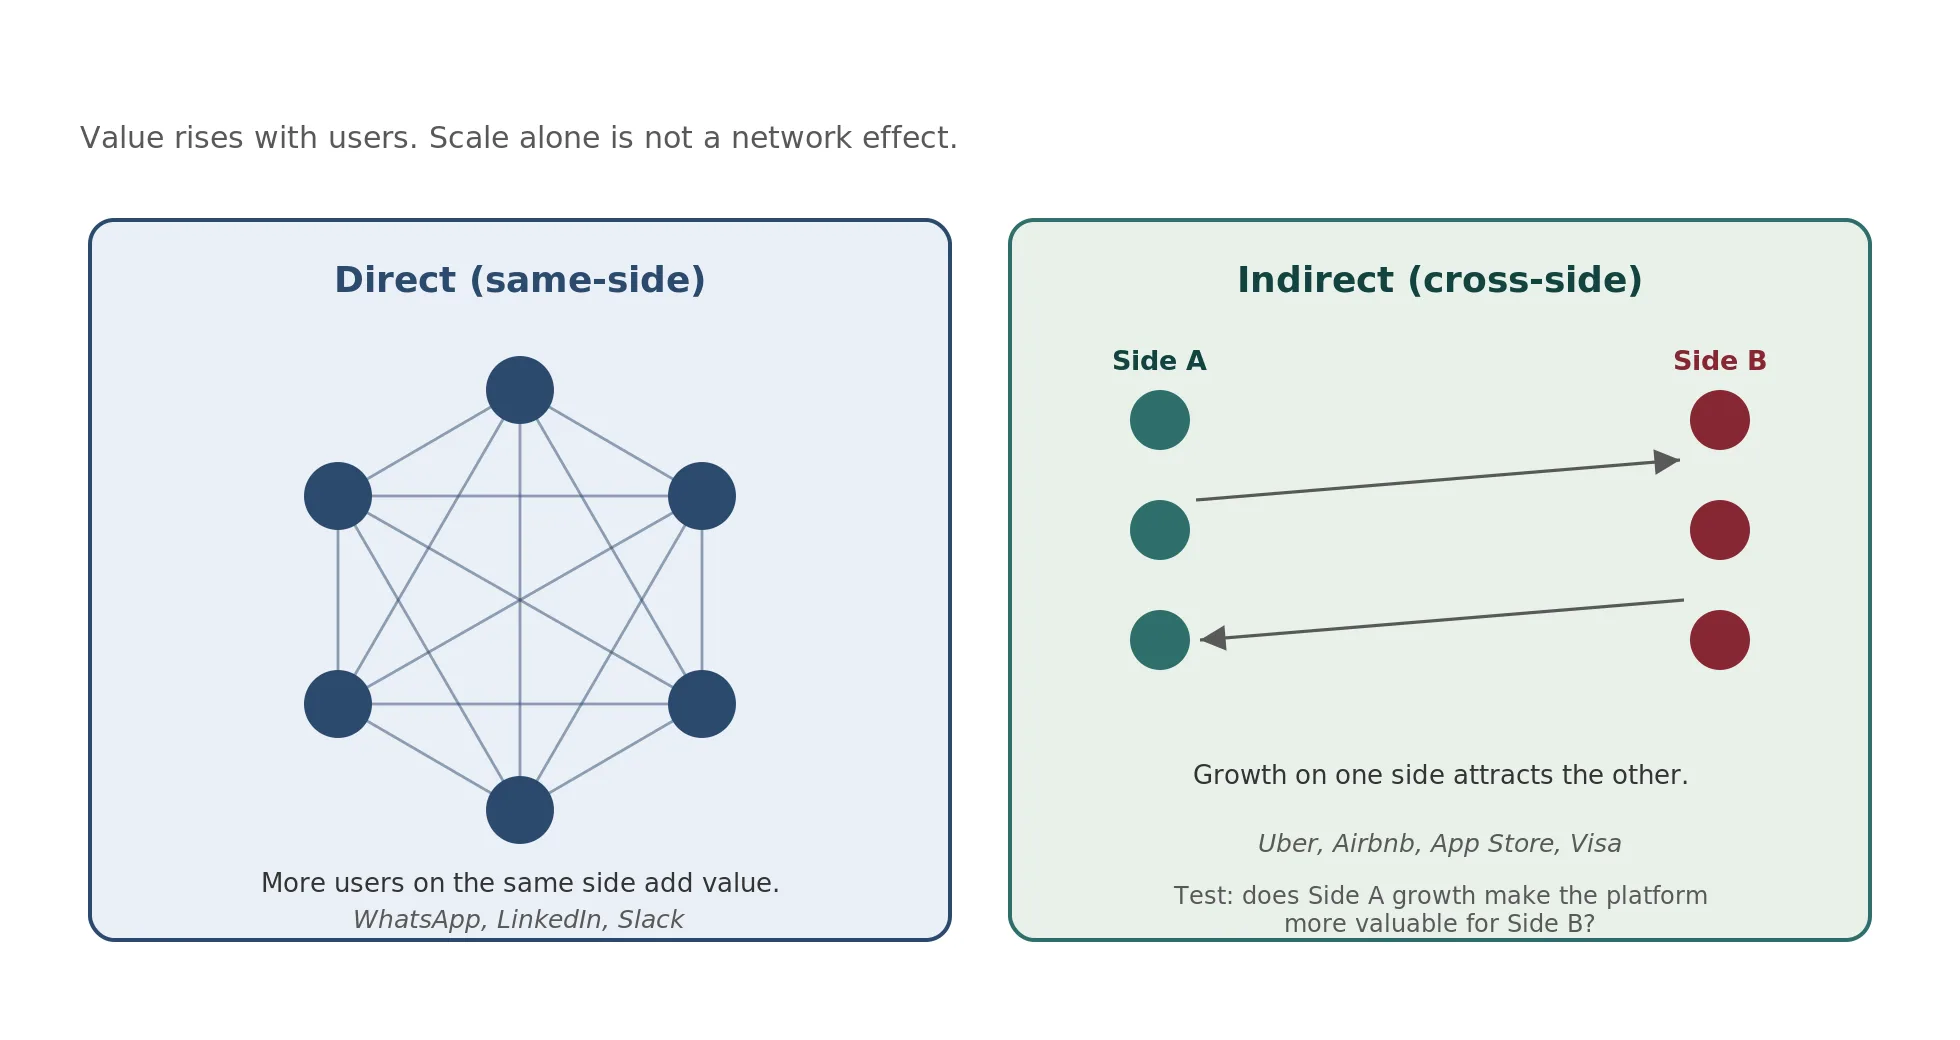
| Direct Network Effects | Indirect Network Effects |
|---|---|
| Same-side value increase. More users on the same side make the product more valuable for everyone. Example: a messaging app (WhatsApp), a social network (LinkedIn), a communication platform (Slack). Test: does adding one more user directly benefit existing users? | Cross-side value increase. More users on one side attract more users on the other side. Example: a marketplace (Uber, Airbnb), an app store (iOS), a payment network (Visa). Test: does growth on Side A make the platform more valuable for Side B? |
Check Your Understanding
Knowledge Check 14
Business & Revenue Models
A SaaS tool is used by 10,000 independent companies that never interact. The founder claims a network-effect moat. Is that correct?
Layer 7
Financial Viability, Limits & What Comes Next
A business can have attractive margins, strong unit economics, and a large addressable market and still die. The cause is almost always cash: the business runs out of money before the economics compound into profitability. Entrepreneurial finance students need to understand that profitability and cash are related but not the same thing, and that cash timing kills more startups than bad business models.
Cash vs. Profitability and the Cash Conversion Cycle
The timing gap
A profitable business can be cash-negative if the timing of cash inflows and outflows does not align. Consider a SaaS company with 12.5-month CAC payback. Every new customer costs $2,000 to acquire, but that cost is paid upfront while the revenue arrives in $160 monthly increments (after COGS) over the following year. If the company acquires 25 new customers per month, it fronts $50,000 in acquisition costs each month that will not be recovered for over a year. The faster the company grows, the more cash it consumes, even though the unit economics are healthy.
This is the core paradox of venture-backed growth: healthy unit economics can still create severe cash needs during scaling. The faster you grow, the more cash you consume in the short term, even if every customer is individually profitable over their lifetime. This is why runway management is not a secondary concern; it is a survival skill.
The cash conversion cycle for startups
Traditional businesses measure the cash conversion cycle as the time between paying for inputs and receiving payment from customers. For startups, the equivalent metric is the time between spending to acquire a customer and recovering that acquisition cost through cumulative contribution margin. This is the CAC payback period.
But the full cash picture includes more than CAC payback:
- Working capital timing: Do you pay suppliers or employees before customers pay you? Net 30 or Net 60 payment terms from enterprise customers can create a 60-90 day gap between delivering value and receiving cash.
- Revenue recognition vs. cash collection: Annual contracts paid monthly look great on a revenue chart but deliver cash slowly. Annual contracts paid upfront (with a discount) improve cash position dramatically even if they reduce total revenue.
- Seasonal patterns: Many B2B companies see buying concentration in Q4 (budget flush) and Q1 (new fiscal year budgets). If your expenses are steady but revenue is lumpy, you need cash reserves to bridge the gaps.
- Capital expenditure timing: Inventory purchases, equipment, office leases, and technology infrastructure all require upfront cash outlays that are not reflected in monthly P&L until they are depreciated or amortized.
Path to Profitability and Runway Management
Path to profitability modeling
Every startup needs a clear model showing how and when the business reaches cash flow breakeven. The model does not need to be precise in its predictions, but it needs to demonstrate that the founder understands the levers:
- Revenue trajectory: Based on customer acquisition rate, average revenue per customer, retention, and expansion. Use bottom-up projections grounded in actual pipeline and conversion rates, not top-down market share assumptions.
- Cost trajectory: Fixed costs (engineering, rent, infrastructure) that remain constant as you scale, and variable costs (COGS, commissions, support) that scale with customers. The gap between revenue growth and cost growth is where profitability emerges.
- Breakeven point: The month where cumulative revenue exceeds cumulative costs, or more practically, where monthly net burn reaches zero. How much total capital is needed to get there?
- Sensitivity analysis: What happens if customer acquisition takes 50% longer than planned? What if churn is 2 points higher? What if your next funding round takes 6 months longer than expected? Model the downside scenarios, because that is what investors stress-test.
Runway management and the fatal pinch
Runway is cash on hand divided by monthly net burn rate. It tells you how many months the business can survive at its current spending rate. But runway is not a static number; it changes as revenue grows and as expenses are managed.
I recommend founders track three versions of runway:
- Current runway: Cash / current net burn. The baseline survival metric.
- Worst-case runway: Cash / gross burn (assuming revenue drops to zero). How long can the business survive if growth stalls completely?
- Projected runway: Cash / projected future net burn (accounting for expected revenue growth). This is the optimistic case, but be honest with the projections.
Below 6 months of current runway, the business is in crisis. Between 6-12 months, fundraising should be the top priority. Between 12-18 months is the healthy fundraising window, because raising a round typically takes 3-6 months from first meeting to wire transfer. Above 18 months provides strategic flexibility to be selective about the next round.
The fatal pinch occurs when runway is short, growth is slow, and the burn rate is locked in through committed expenses (leases, salaries, contracts). At that point, the founder has no good options: cutting expenses enough to extend runway usually means laying off the team that is supposed to drive growth, but continuing to burn at the current rate means running out of cash. The best prevention is conservative hiring and maintaining at least 15-18 months of runway after every funding event.
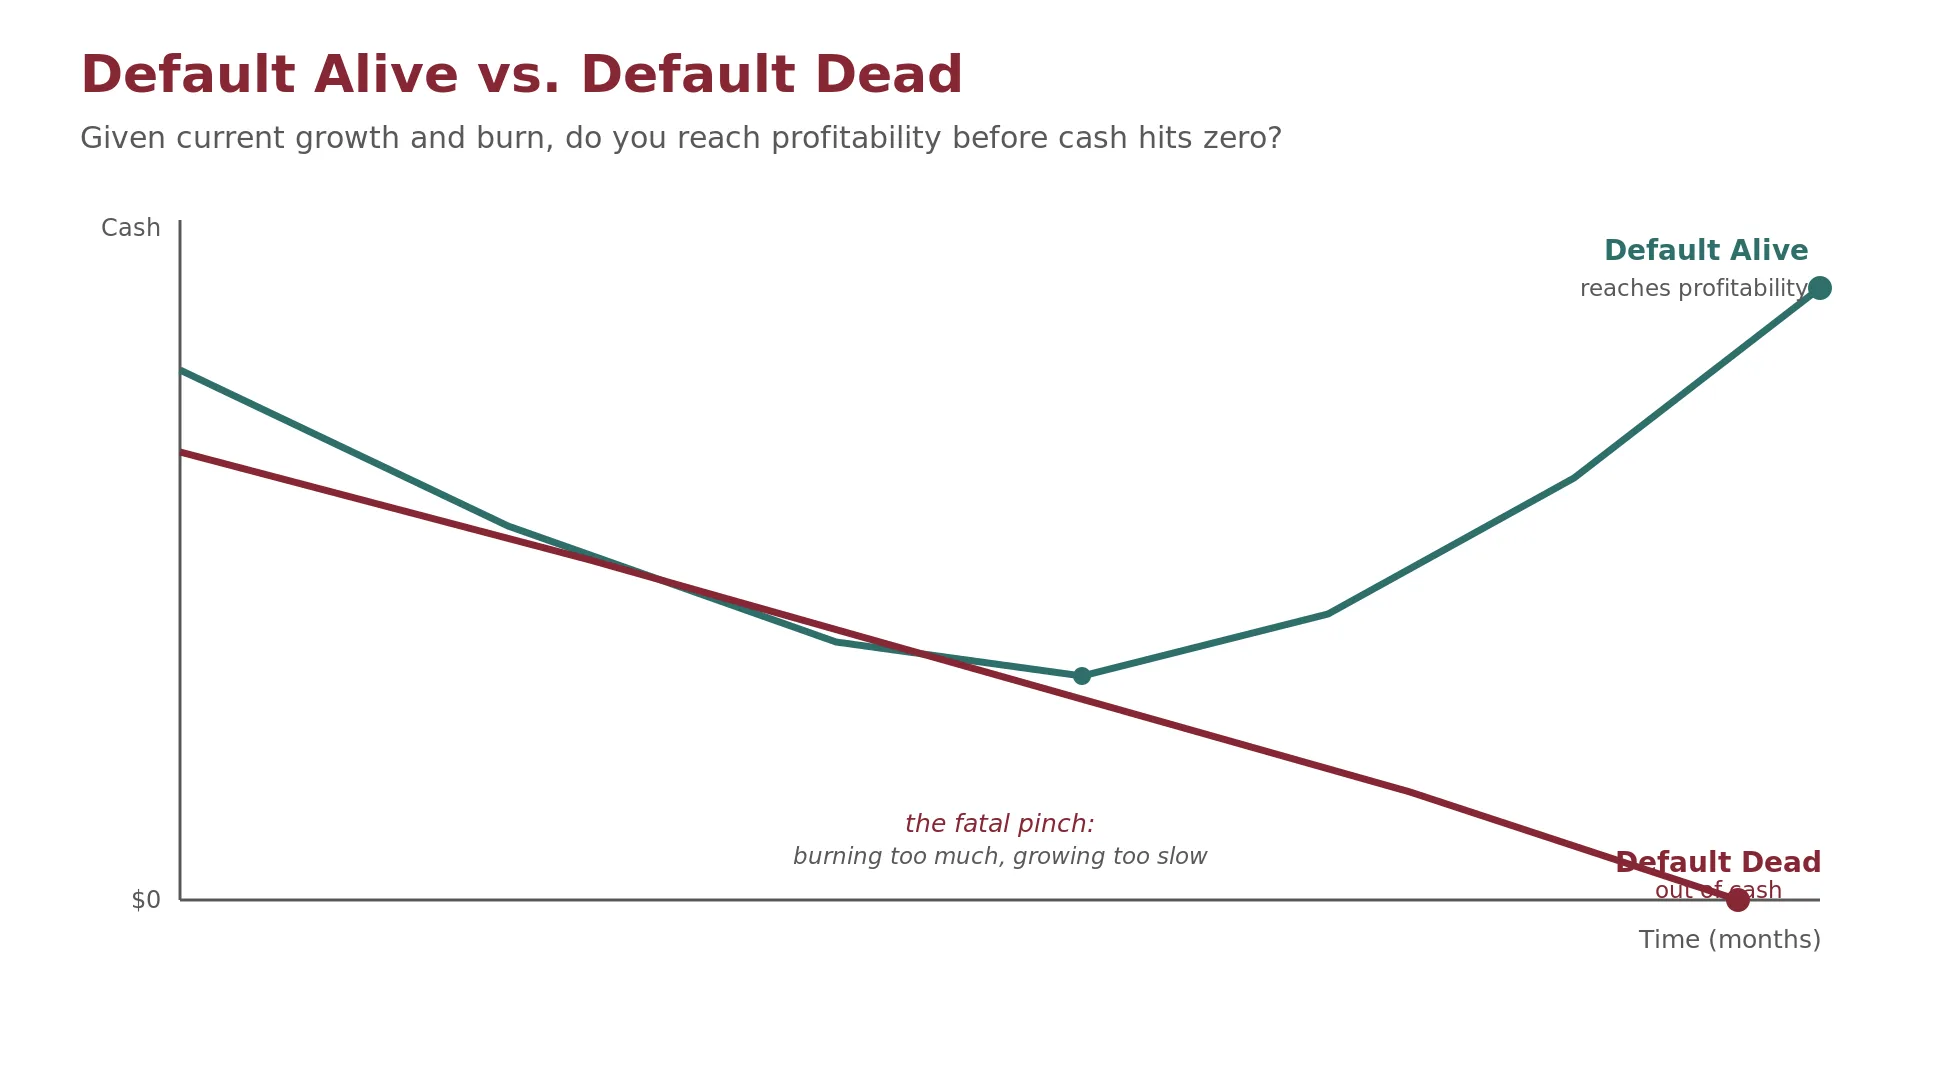
Enter cash on hand, gross burn, monthly revenue, and a revenue growth rate to see current and worst-case runway, plus the Default Alive / Default Dead verdict, that is, whether growth reaches profitability before the cash runs out, relative to the crisis, fundraising, and healthy-buffer thresholds above.
Check Your Understanding
Knowledge Check 15
Runway, Burn & Financing Need
A startup raised a round, hired aggressively, and now has short runway, slow growth, and committed salary and lease costs. What is this, and what is the lesson?
What Investors Look for at Each Stage
The financial evidence investors expect scales with the funding stage. Understanding what matters at each stage helps founders focus their preparation:
| Stage | What Investors Expect | Key Metrics |
|---|---|---|
| Pre-Seed | Team credibility, problem validation, market size thesis, early customer interviews | Evidence Ladder Level 2-3, TAM analysis, founder-market fit |
| Seed | Early product-market fit signals, initial unit economics, first paying customers | Evidence Ladder Level 4-5, preliminary CAC and LTV, monthly revenue run rate |
| Series A | Repeatable acquisition channel, proven LTV:CAC, clear path to scale | LTV:CAC > 3:1, CAC payback < 18 months, month-over-month growth rate, cohort retention |
| Series B+ | Operating leverage emerging, net revenue retention, path to profitability | NRR > 110%, improving contribution margins, declining burn multiple, default alive trajectory |
The Venture Viability Scorecard
The seven preceding layers provide the analytical tools. The Venture Viability Scorecard integrates them into a single diagnostic assessment, similar to how the Founder Archetype Matrix integrates the three dimensions of founder assessment. Use this scorecard when evaluating any business opportunity, whether as an advisor assessing a client's business idea, an investor evaluating a pitch, or a founder stress-testing their own venture.
| Assessment Layer | Key Question | Red Flag If... |
|---|---|---|
| 1. Problem-Solution Fit | Does this solve a real problem that specific people will pay to solve? Where is the founder on the Evidence Ladder? | Cannot name the customer, articulate the problem in one sentence, or show evidence above Level 2 |
| 2. Revenue Model | How does the business capture value, and what are the margin implications? | Revenue model unclear, or model chosen does not match the offering's delivery method |
| 3. Pricing Strategy | Is the price justified by value delivered, and does the price metric align with customer value creation? | Pricing based on competitor matching or cost-plus with no value analysis; price metric misaligned |
| 4. Channel & GTM | Can the business reach customers efficiently through its chosen channel? Does the sales motion match the ACV? | Sales motion mismatched to price point or customer type; adoption friction unaddressed |
| 5. Unit Economics | Does each transaction create value? Is LTV > CAC with acceptable payback? Does CM2 hold? | Negative contribution margin, LTV:CAC below 1:1, payback > 24 months, or churn above 5% monthly |
| 6. Market & Competition | Is the market large enough, and can the business defend its position? Is the beachhead credible? | TAM too small, no credible moat, structural industry forces compress margins, no beachhead strategy |
| 7. Financial Viability | Does the path to profitability make sense given available capital? Is the business default alive? | Runway < 12 months with no path to profitability, no cash management plan, or default dead trajectory |
If you can succinctly address the problem your business solves, demonstrate how the economics of your solution are profitable and sustainable given your business model, show that the unit economics hold under rigorous analysis (including CM2 and cohort tracking), and show how that solution scales to address a large target market that you can capture a reasonable percentage of based on rigorous analysis, all while managing cash to reach profitability before running out of runway, you have an excellent path toward funding and execution. This is the core analytical skill of entrepreneurial finance.
Limits of the Framework
The Venture Economics Framework is a diagnostic scaffold, not a formula. It orders the questions worth asking and shows how they connect. It does not compute the answer, and it does not remove the need for judgment.
Benchmarks are heuristics, not passing grades
The benchmarks used throughout, including the roughly 3:1 LTV:CAC target, sub-18-month CAC payback, 120 to 140% net revenue retention, and the burn-multiple thresholds, are practitioner heuristics rather than universal constants. They vary by sector, business model, and point in the economic cycle, and they should be read as reference points, not passing grades.
The framework is weighted toward software and venture scale
The framework is weighted toward software and venture-scale businesses. Capital-intensive, deep-technology, biotechnology, and small-business or lifestyle ventures follow different timelines and cost structures, and several benchmarks here will not transfer cleanly to them.
What the framework does not assess
The framework assesses economic viability. It does not assess execution quality, team dynamics, timing, or regulatory and macroeconomic shocks, all of which also decide outcomes. A business can pass every layer and still fail on factors outside the model.
What Comes Next: From Assessment to Financial Modeling
The Venture Economics Framework provides the analytical foundation for evaluating whether a business opportunity makes economic sense. But assessment is only half the job. Once you have determined that the problem is real, the revenue model is sound, the unit economics hold, the market is large enough, and the cash path is viable, the next question is: how do we model this financially, and how do we structure the capital to execute it?
The next module of this course moves from qualitative and diagnostic analysis to quantitative financial modeling. Specifically, we will cover three areas that build directly on the seven layers:
Financial Statement Analysis and Free Cash Flow to Firm (FCFF)
You have seen how reading financial statements reveals the revenue model and cost structure of a business. The next step is learning to project those statements forward: building income statement, balance sheet, and cash flow forecasts that translate the assumptions from this framework into numbers. FCFF is the metric that tells you how much cash the business generates for all capital providers (debt and equity) after accounting for operating expenses, taxes, and reinvestment. For startups, FCFF is typically negative in the early years, and the key modeling question is when and how it turns positive.
Free Cash Flow to Equity and Startup Valuation
FCFE adjusts for debt service to show what equity investors receive. Combined with a cost of equity (often estimated through build-up methods for private companies rather than traditional CAPM), FCFE forms the basis for discounted cash flow (DCF) valuation of startups. We will also cover comparables analysis (revenue multiples, ARR multiples) and how venture capitalists actually price rounds, which often diverges significantly from DCF-implied values.
Capital Structure and Funding Strategy
With a financial model in hand, the question becomes: how much capital does the business need, when does it need it, and what form should it take? We will cover equity financing (pre-money and post-money valuation, dilution, liquidation preferences, anti-dilution provisions), debt instruments (venture debt, revenue-based financing, convertible notes, SAFEs), and the strategic tradeoffs between them. The goal is to match the capital structure to the business model: a high-burn SaaS company with strong unit economics requires different financing than a capital-efficient services business.